How To Use the Model Projections & Model Profitability Dashboards: A Complete Guide
January 28, 2026
*Part of the Mama Knows Bets Education Series. See also: What is +EV Betting?, Bankroll Basics, Why Taking the Best Odds Matters, and *How to Use the Value Finders
Introduction
If you've used our Value Finders, you know they identify +EV opportunities based on sharp book consensus - finding bets where the odds you're getting are better than what the market "should" be offering.
The Model Projections Dashboard and Model Profitability Dashboard take a different approach. Instead of relying on sharp book consensus to determine fair value, these tools use our proprietary probability models to estimate the true likelihood of outcomes.
In simple terms: the Value Finder asks "what does the market think?" while the Model Projections ask "what do WE think?"
Both approaches can find +EV opportunities, but they find them in different ways - and sometimes find different opportunities entirely.
Part 1: The Model Projections Dashboard
Dashboard Overview
The Model Projections Dashboard is available for multiple sports (NBA, NHL, and more as we expand). While the specific stats and markets vary by sport, the structure and functionality remain consistent across all versions.
Core Projections Tabs:
-
By Game - Player projections grouped by game and team
-
Game Projections - Team-level matchup analysis with offense/defense scores
-
Player Projections - Full table of all player projections with stats
-
Game Logs - Historical performance data for the season
Betting Opportunity Tabs (varies by sport):
-
Sport-specific prop markets with model + market data combined
-
NBA examples: First Basket, Double Double, Triple Double
-
NHL examples: Anytime Goal Scorer, 2+ Goals, First Goal Scorer
Model Edge Tabs:
-
MKB Model Opps - Opportunities where our model identifies edge
-
💎 Double Edge - Premium opportunities where BOTH model AND market agree
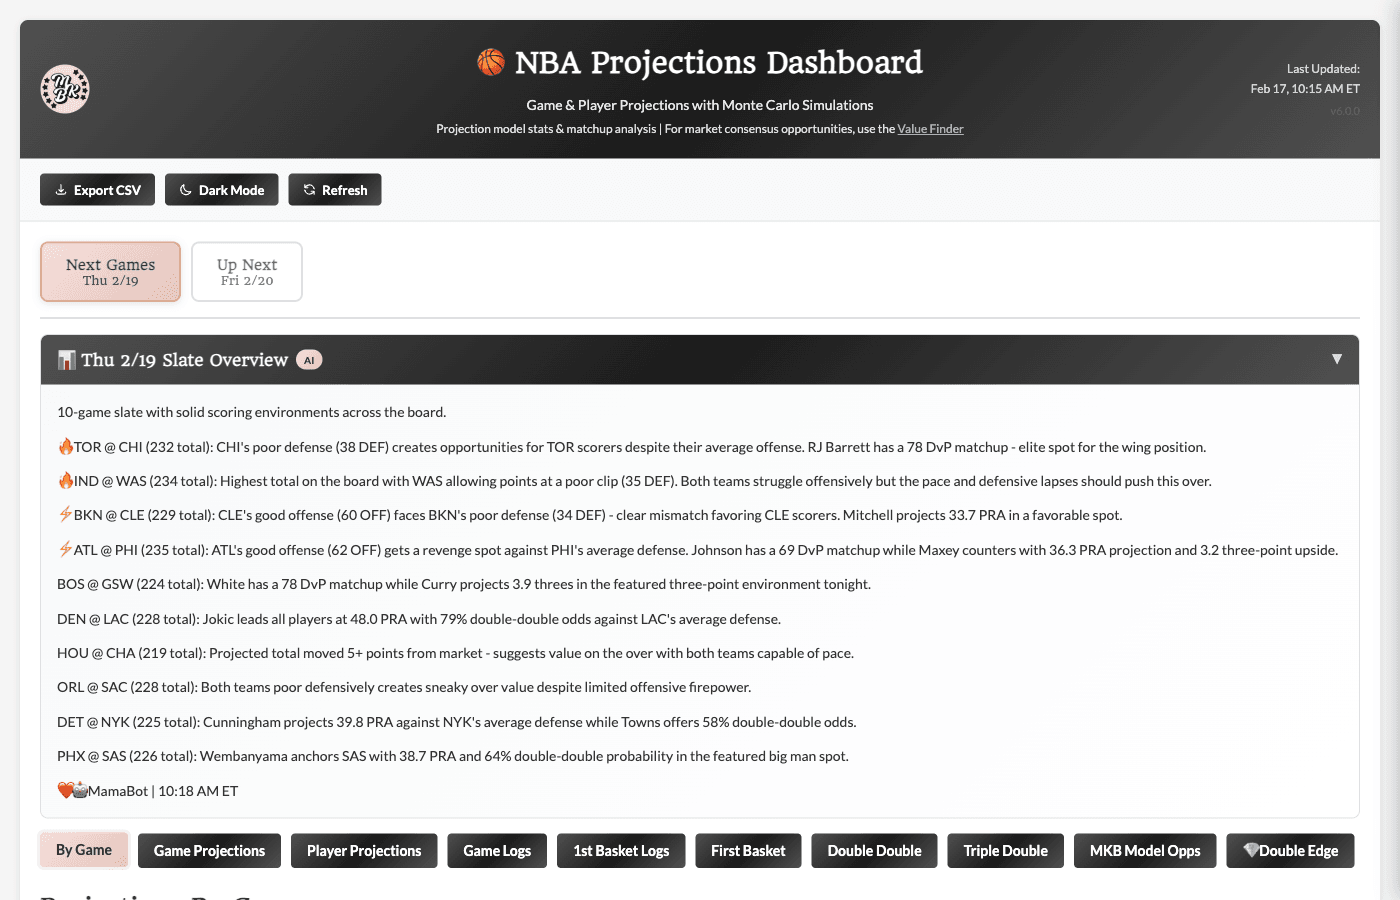
Day Selection & AI Summary
At the top of the dashboard, you'll find:
Day Selector Tabs
Switch between Today and Tomorrow to view projections for different dates. The dashboard remembers your selection as you navigate between tabs.
MamaBot AI Summary
Below the day selector, an AI-generated summary provides a quick overview of the day's slate. The content adapts to each sport but typically includes:
-
Key matchup insights - Notable offense vs defense mismatches
-
Scoring environment analysis - High-scoring vs low-scoring game expectations
-
Model edge highlights - Where our projections differ significantly from market totals
-
Player spotlights - Key players to watch based on matchup and projection factors
Click the header to expand/collapse this section. It's a great starting point before diving into the detailed tabs.
Tab 1: By Game (Default View)
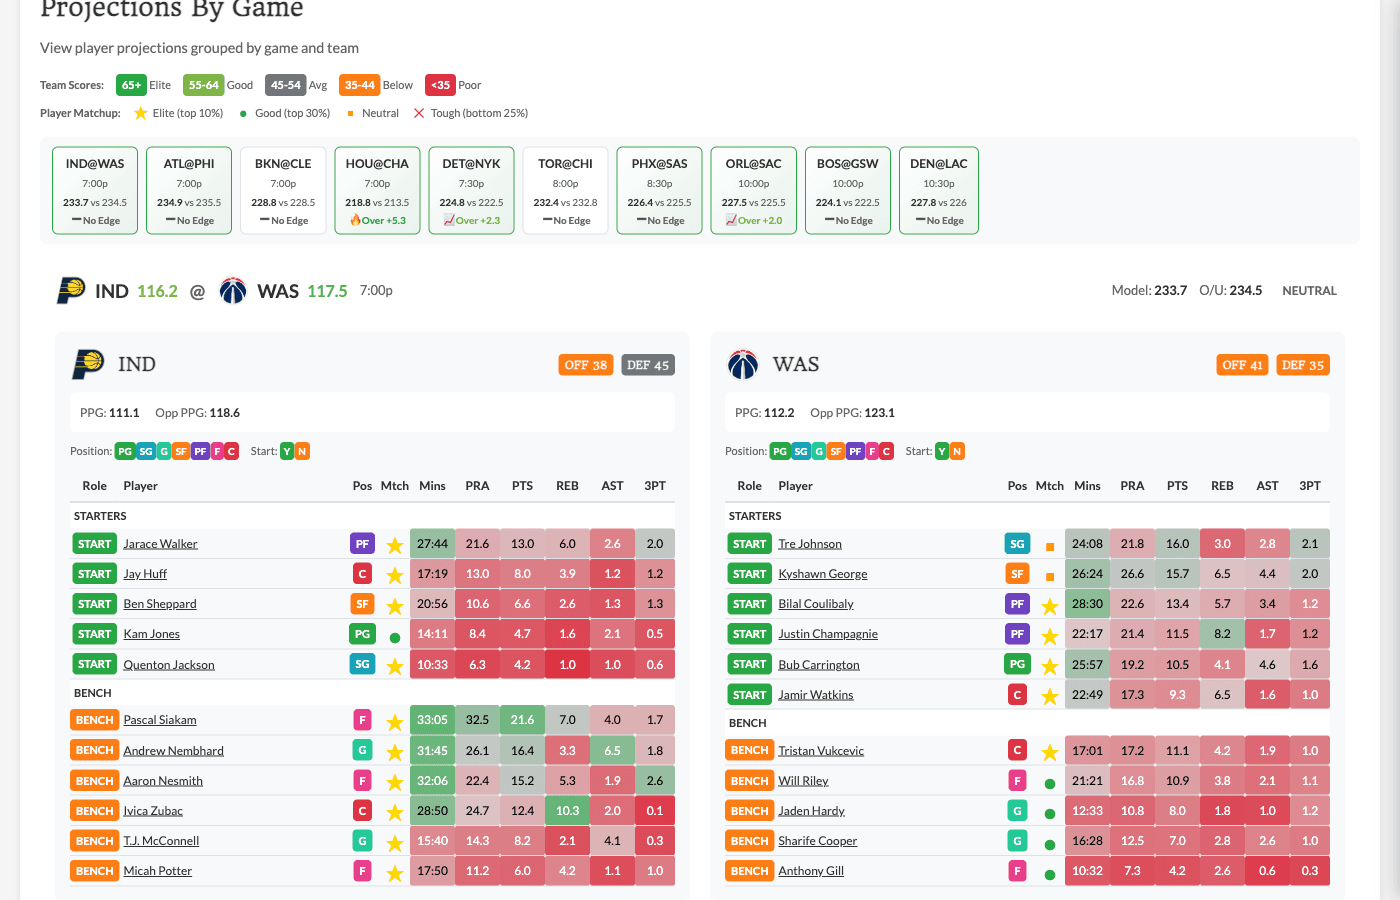
The By Game tab is the default landing page and shows player projections organized by matchup.
Summary Bar
At the top, a horizontal scroll bar shows all games for the day as clickable chips. Each chip displays:
-
Team matchup (e.g., "LAL@BOS" for NBA or "TOR@BOS" for NHL)
-
Game time
-
Model vs market total comparison
-
Edge indicator (colored if model differs significantly from market)
Click any chip to scroll directly to that game's section.
Game Cards
Each game has a dedicated card showing:
Header:
-
Team matchups with records
-
Game time
-
Projected total vs market O/U
-
Edge indicator (green for model-over, red for model-under)
Team Sections:
-
Each team has its roster listed with key projections
-
Players sorted by projected contribution to the game
Player Rows (vary by sport): NBA:
-
Player name and position (PG, SG, SF, PF, C)
-
Role indicator (Starter vs Bench)
-
Projected Points, Rebounds, Assists
-
Projected PRA (combined total)
NHL:
-
Player name and position (C, LW, RW, D)
-
Line assignment (1st line, 2nd line, etc.) and PP unit
-
Projected Goals, Assists, Points
-
Projected Shots on Goal
Click any player row to expand and see more detailed projections and charts in the Player Modal.
Using By Game Effectively
This view is perfect for:
-
Getting a quick overview of who's playing tonight
-
Comparing player projections within a game context
-
Identifying games with interesting total discrepancies (model vs market)
-
Quickly navigating to specific matchups
-
Viewing player details in the Player Modal
Tab 2: Game Projections
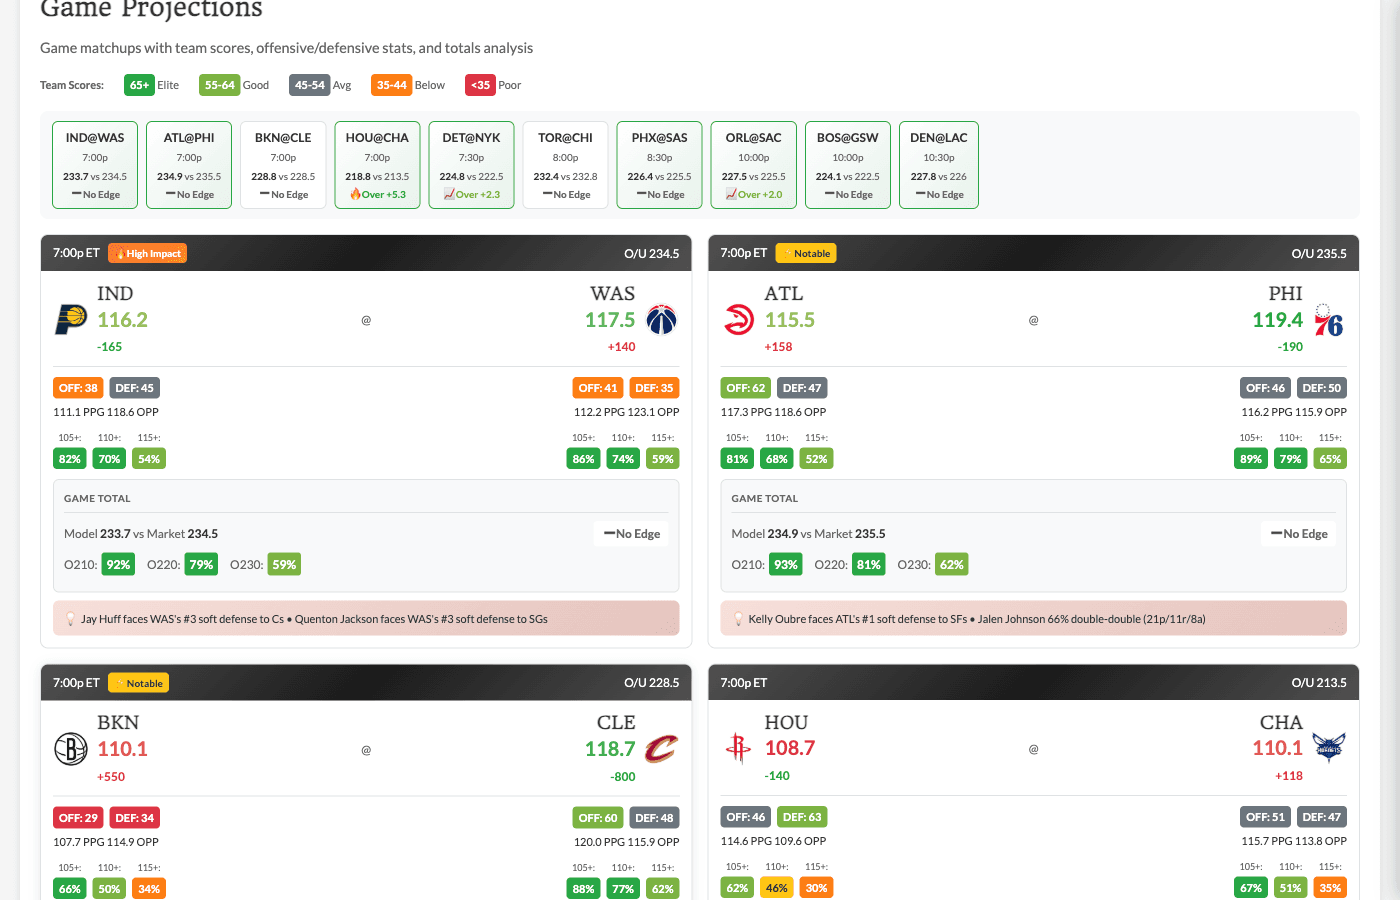
The Game Projections tab provides team-level analysis for each matchup.
Matchup Cards
Each game displays as a detailed matchup card showing:
Team Scores (0-100 scale):
-
Offense Score - How good is this team's offense? (65+ = Elite, 55-64 = Good, 45-54 = Avg, 35-44 = Below, <35 = Poor)
-
Defense Score - How good is this team's defense? (same scale)
Scores are color-coded badges for quick visual scanning.
Game Metrics:
-
Projected Total - Our model's projected combined score
-
Market O/U - The current market over/under line
-
Edge - Difference between model and market (positive = model projects higher)
-
Spread - Current market spread
Key Insights: Each card includes 1-2 auto-generated insights based on the matchup:
NBA examples:
-
"Lakers elite offense (68) vs Celtics poor defense (32)"
-
"Both teams favor offense over defense - high-scoring potential"
-
"Model projects 4.5 more points than market"
NHL examples:
-
"Oilers elite offense (72) vs Sharks poor defense (28)"
-
"Two strong defensive teams - low-scoring potential"
-
"Model projects 0.8 fewer goals than market"
Understanding Team Scores
Team scores are composite ratings (0-100) based on:
-
Recent offensive/defensive efficiency
-
Pace/tempo factors
-
Home/away adjustments
-
Schedule strength and rest days
How to use:
-
High offense + opponent's low defense = look for player overs
-
High defense + opponent's low offense = consider unders
-
Both teams high offense + low defense = potential shootout (over on total)
-
Both teams high defense = grind game (under on total)
Tab 3: Player Projections
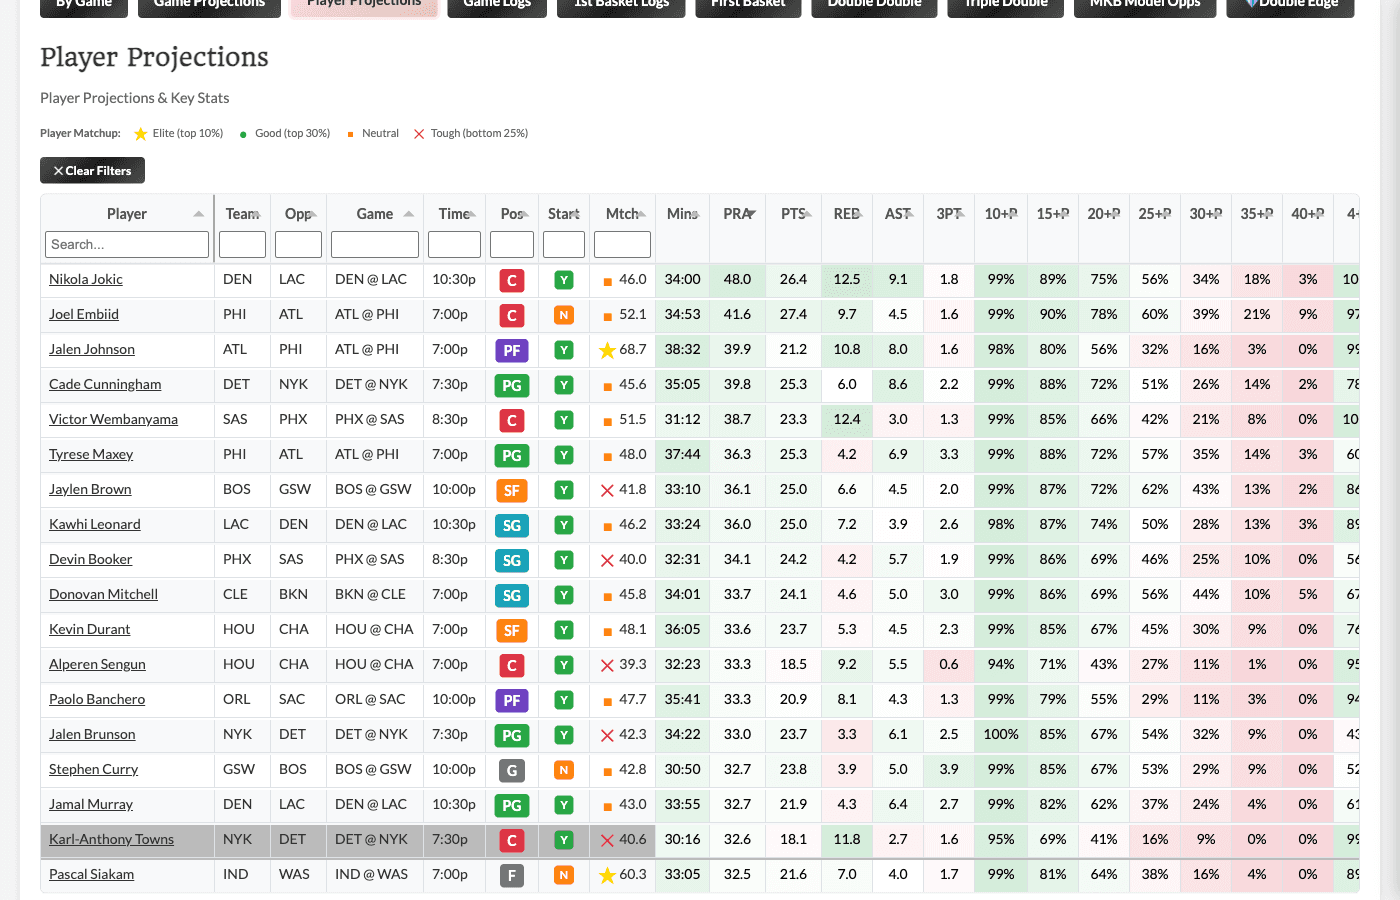
The Player Projections tab shows a comprehensive table of all players with projections.
Key Columns
Player Info:
-
Player name, team, position
-
Opponent
-
Role indicator (Starter/Bench for NBA; Line assignment for NHL)
Core Projections (vary by sport): NBA:
-
Proj Points, Proj Rebounds, Proj Assists
-
Proj 3PM (three-pointers made)
-
Proj PRA (Points + Rebounds + Assists combined)
NHL:
-
Proj Goals, Proj Assists, Proj Points
-
Proj SOG (Shots on Goal)
-
Line assignment and PP unit
Monte Carlo Probabilities: These columns show the probability of hitting specific thresholds based on our simulation model:
NBA examples:
-
20+ PTS %, 25+ PTS %, 30+ PTS %
-
8+ REB %, 10+ REB %
-
6+ AST %, 8+ AST %
-
Double Double %
NHL examples:
-
Goal % (Anytime Goal Scorer)
-
2+ Goals %, 3+ Goals %
-
3+ SOG %, 4+ SOG %, 5+ SOG %
The thresholds shown align with common prop betting lines for that sport.
Matchup Context:
-
Matchup Score - Overall favorability of the matchup (0-100)
-
DvP - Defense vs Position rating (how the opponent defends this position/role)
-
NHL-specific: Matchup boost factor based on line matchups
Filtering and Sorting
Sort by any column to find what you're looking for:
-
Sort by projected stats to see highest-usage players
-
Sort by threshold probabilities to find best chances for specific outcomes
-
Sort by matchup factors to find favorable situations
Filter by:
-
Team
-
Position (varies by sport)
-
Role (e.g., Starters only, Bench only for NBA; Top-6 forwards, Top line D for NHL)
Search for specific players using the search box.
Using Monte Carlo Probabilities
The Monte Carlo columns are powerful for prop betting. Compare them to book implied probabilities to find edge. The below are examples but you can also jump directly to see opportunities vs. our model projections in the MKB Model Opps and Double Edge tabs - more info on those further down in this article!
Example (NBA): You're considering Player X Over 24.5 Points
-
Find Player X in the table
-
Check "25+ PTS %" - if it shows 52%, that's roughly what the model thinks the probability is
-
Compare to the book's implied probability from the odds
-
If the book implies 45% but our model says 52%, that's potential edge
Example (NHL): You're considering Player Y Anytime Goal Scorer at +280
-
Find Player Y in the table
-
Check "Goal %" - if it shows 32%, that's the model's estimated probability
-
+280 odds imply ~26% probability
-
Model says 32% vs book's 26% = potential 6 percentage point edge
Tab 4: Game Logs
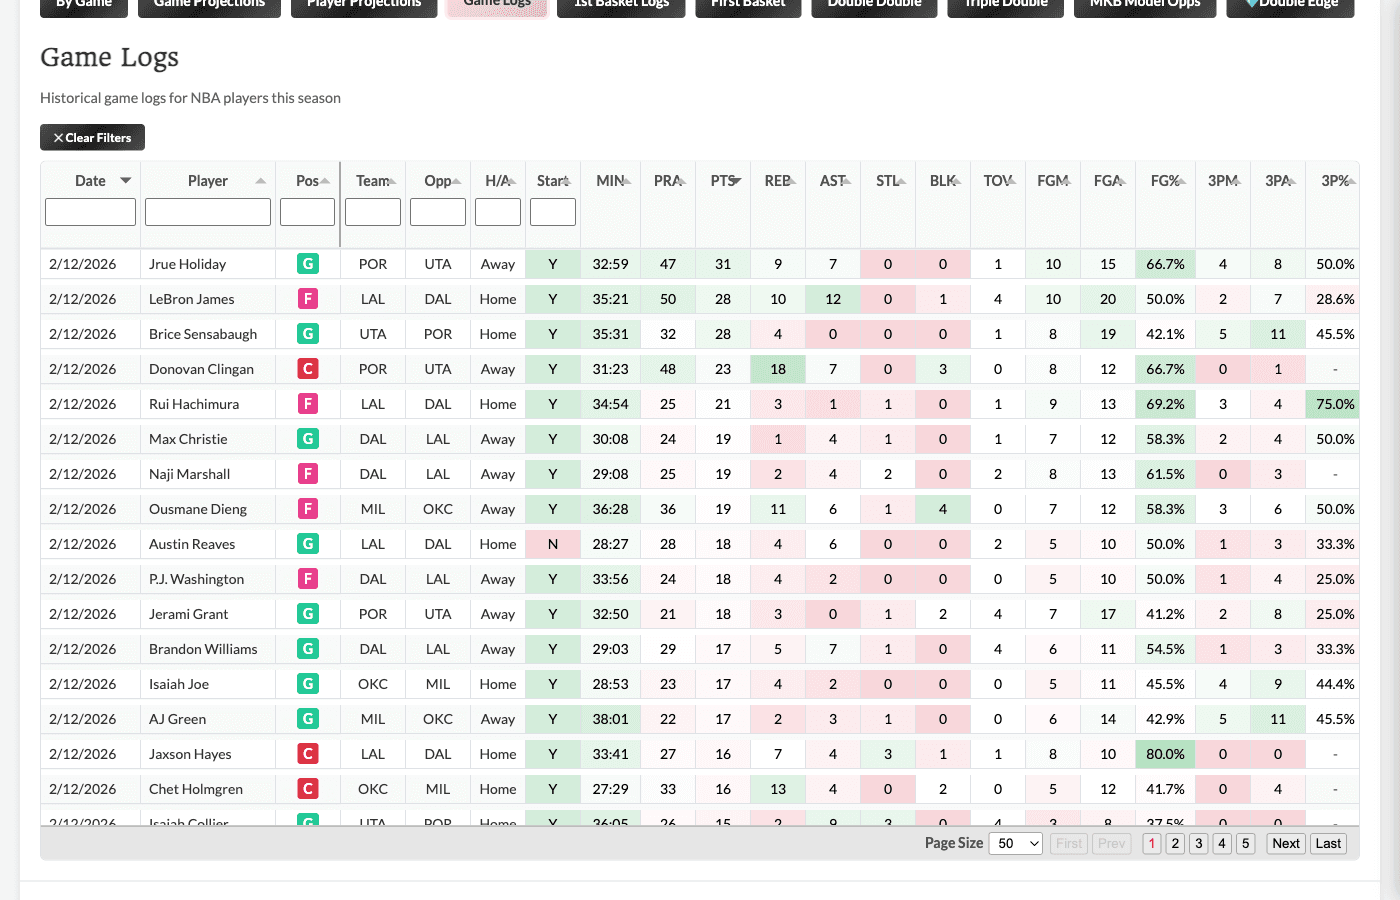
The Game Logs tab shows historical performance data for players this season.
What You'll See
The specific stats vary by sport:
NBA:
-
Date, opponent, home/away
-
Minutes played
-
Points, Rebounds, Assists, Steals, Blocks
-
Three-pointers made/attempted
-
Fantasy points
NHL:
-
Date, opponent, home/away
-
Time on Ice (TOI), PP TOI
-
Goals, Assists, Points
-
Shots on Goal, Hits, Blocked Shots
-
Power Play Points
Using Game Logs
Game logs help you:
-
Verify recent form - Is a player trending up or down?
-
Check vs opponent - How did they perform in previous meetings this season?
-
Identify patterns - Does this player perform differently at home vs away?
-
Validate projections - Do our projections align with recent performance?
Pro tip: Cross-reference game logs with the tooltip hit rates on the Value Finder. If a player has consistently hit a threshold in recent games, and our model projects them favorably, that's extra confidence.
Betting Opportunity Tabs (Sport-Specific Markets)
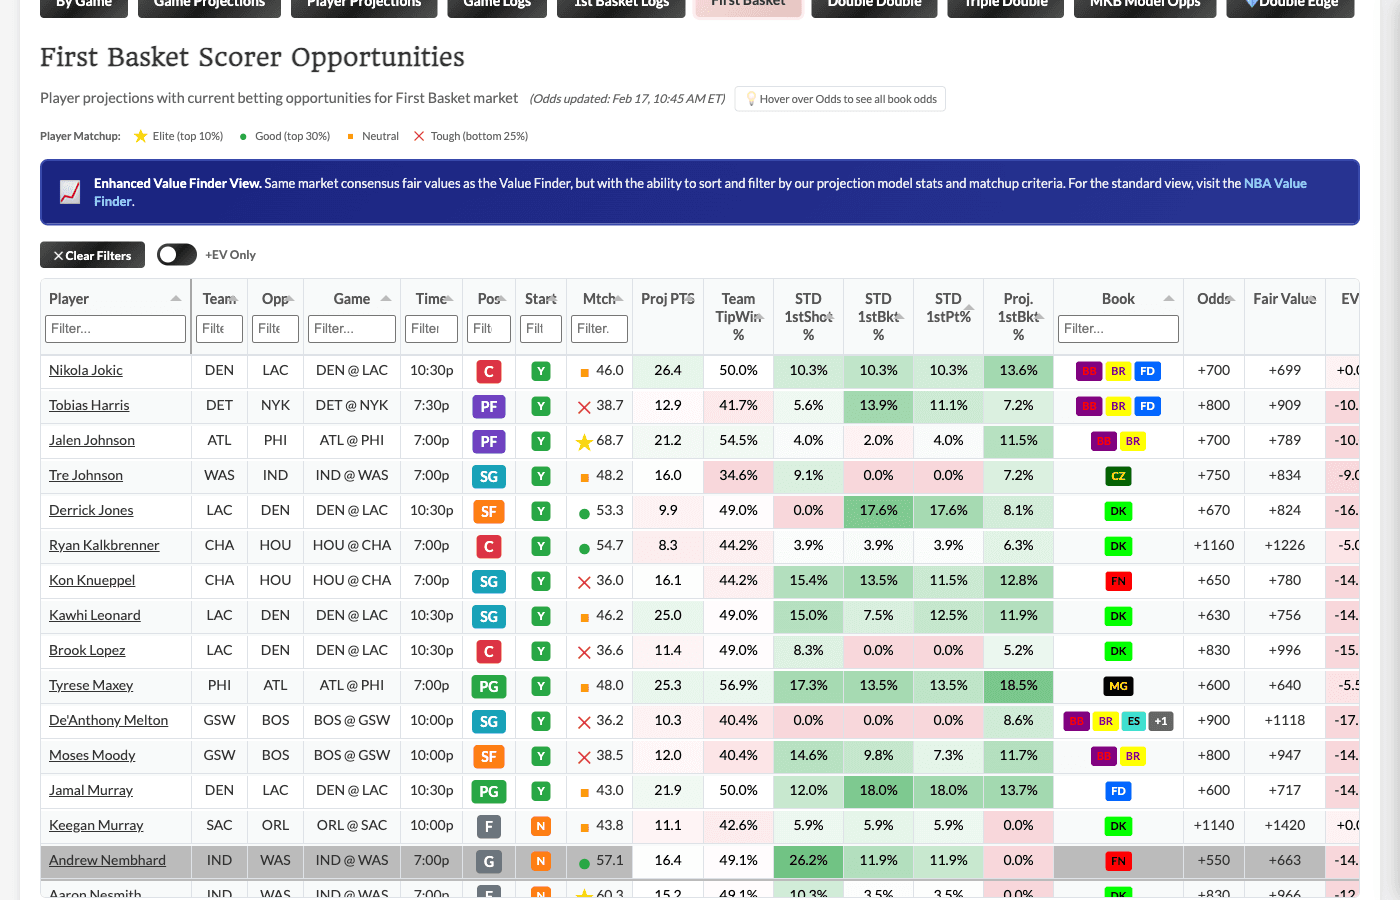
Each sport's Projections Dashboard includes tabs for key prop markets specific to that sport. These tabs combine our model projections with market fair values to give you multiple angles on each opportunity.
What's Available
The specific tabs vary by sport:
NBA:
-
First Basket Scorer
-
Double Double
-
Triple Double
NHL:
-
Anytime Goal Scorer
-
2+ Goals
-
First Goal Scorer
Future sports will have their own relevant prop market tabs as we expand.
How These Tabs Work
Each betting opportunity tab shows opportunities with player details alongside market fair values (same as the Value Finder). Think of it as an "Enhanced Value Finder View" - you get the same market consensus fair values, but with the ability to sort and filter by our projection model stats too.
Key columns you'll see:
-
Player projection data (model probability for the outcome)
-
Historical hit rates for this player/market
-
Matchup context (DvP, line assignment, etc.)
-
Best book and current odds
-
EV % and Kelly recommendations
-
Fair odds based on market consensus
Why Use These Tabs vs the Value Finder?
The main advantage is context. On the Value Finder, you see the math (EV%, Kelly, Fair Value). On these tabs, you also see:
-
Model probability estimates for the specific outcome
-
Matchup factors that inform your confidence
-
Player projection stats and historical rates
Example use cases:
-
"Show me First Basket opportunities where the player is a starter AND has a favorable DvP matchup"
-
"Show me Anytime Goal Scorer opportunities where the player is on the 1st power play unit"
-
"Show me Double Double opportunities where the model probability exceeds 40%"
Note that you can also view player details and projections in the Value Finder directly, as a tooltip on Player Name hover and a more streamlined Modal on click.
Tab: MKB Model Opps
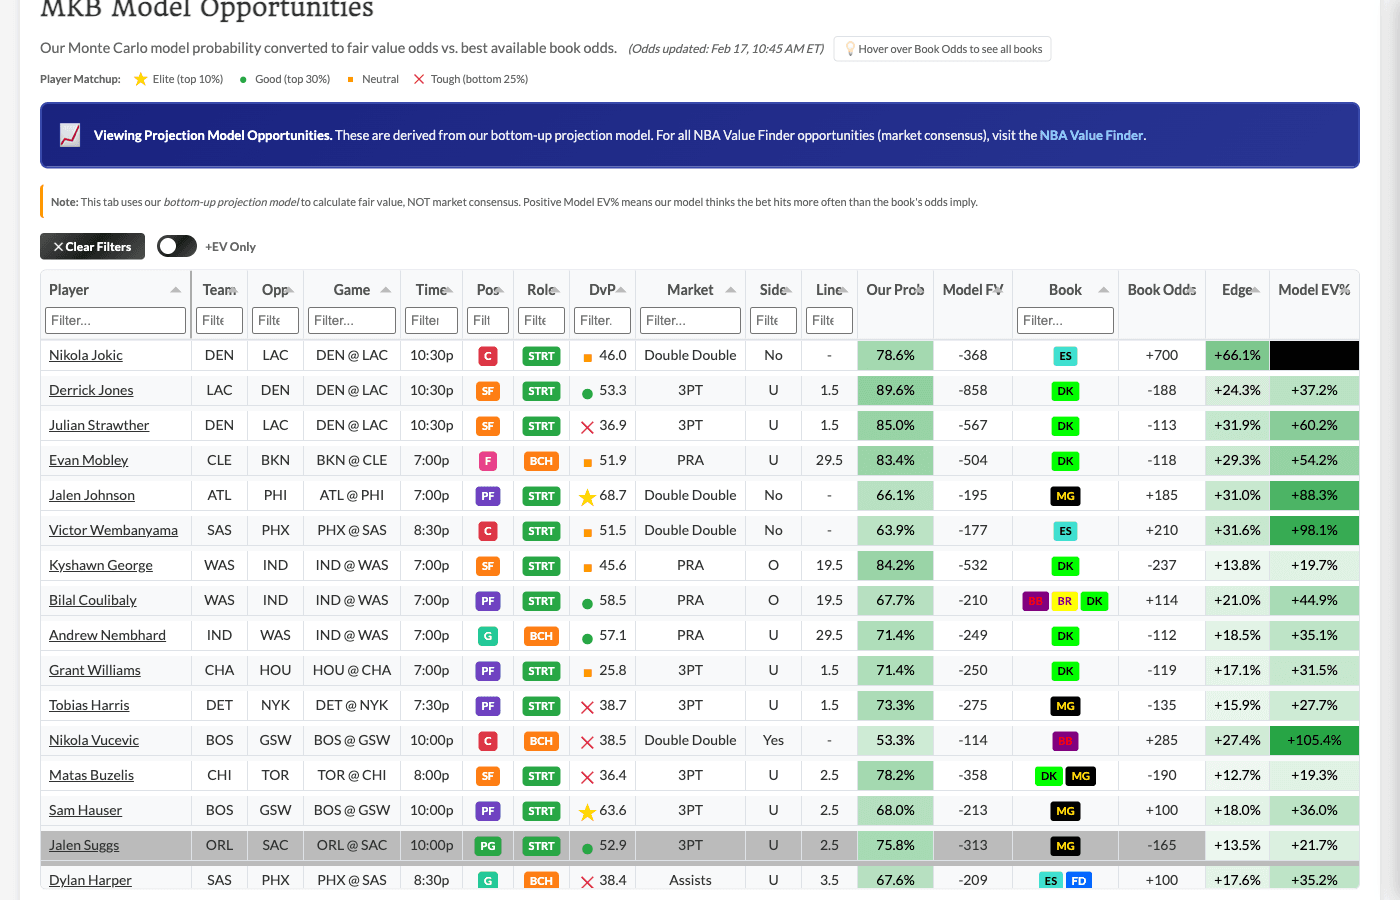
The MKB Model Opps tab shows opportunities where our probability model disagrees with the sportsbooks.
How It Works
When our model thinks an outcome is more likely than the book's odds imply, that's a potential +EV opportunity - even if the sharp book consensus doesn't see it.
Example (NBA):
-
Our model: Player X has 55% chance of going over 24.5 points
-
Book odds: -115, implying ~53.5% probability
-
That's a ~1.5 percentage point edge
Example (NHL):
-
Our model: Player Y has 35% chance of scoring a goal
-
Book odds: +320, implying ~24% probability
-
That's an ~11 percentage point edge
Key Columns
-
Our Probability - What our model estimates as the true probability
-
Book Implied Prob - What the book's odds imply
-
Model Fair Value - Odds that would be "fair" based on our probability
-
Edge - Percentage difference between our probability and book's implied
-
Model EV - Expected value percentage
-
Model Kelly - Recommended bet size using Kelly criterion
Model Kelly vs Value Finder Kelly
Important distinction: Model Kelly is based purely on our probability estimate, NOT market consensus. It can be more aggressive than the Value Finder's Confidence-Adjusted Kelly because it doesn't account for how many books are reporting.
Use discretion on sizing - consider using a fraction of the Model Kelly recommendation.
Tab: 💎 Double Edge
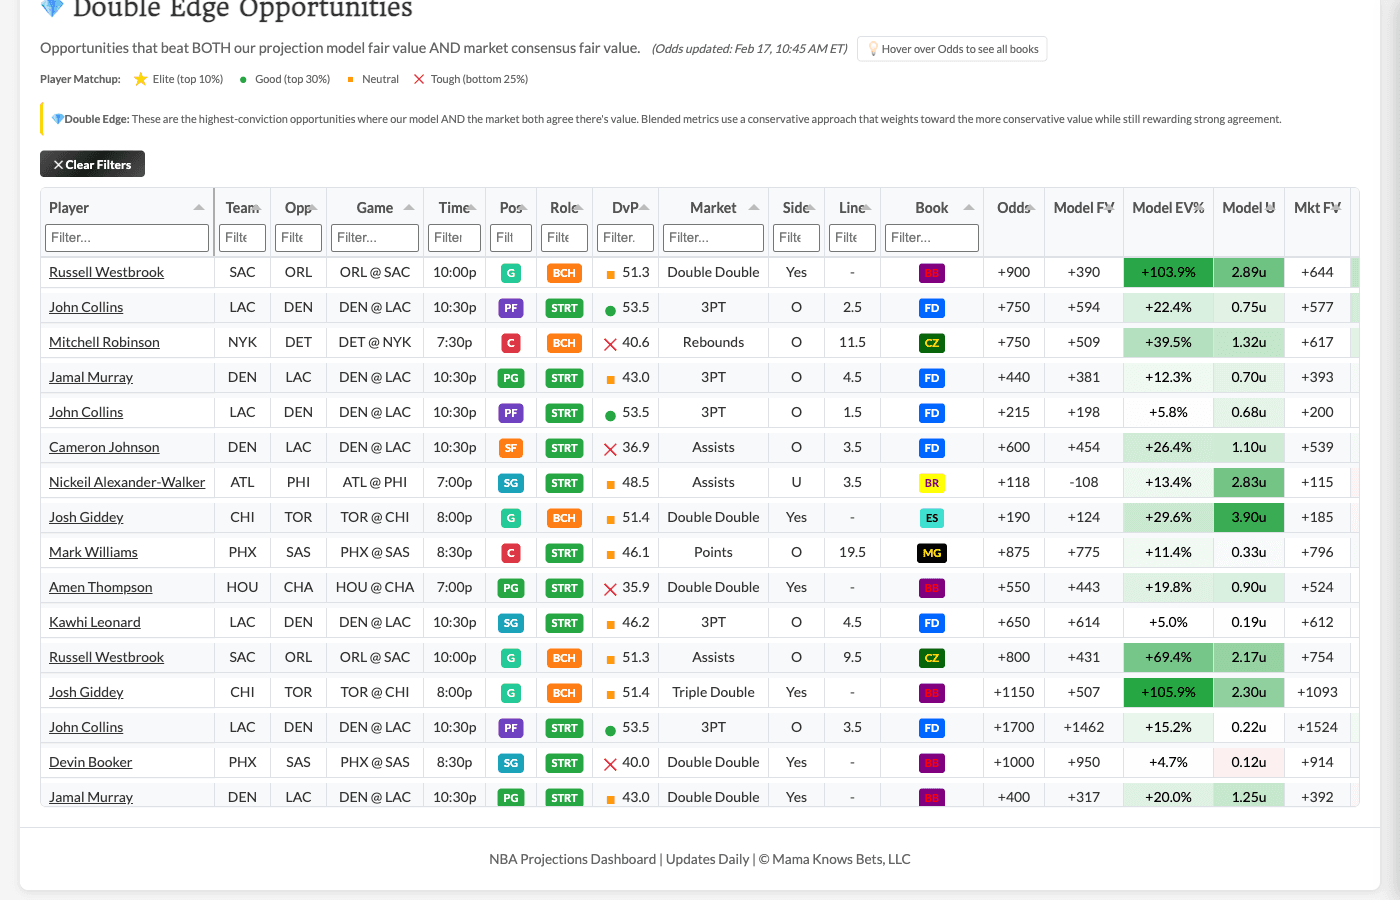
The Double Edge tab is the premium view showing opportunities where BOTH our model AND market consensus agree there's an edge.
Why Double Edge Matters
When two independent methods both identify the same opportunity as +EV:
-
Our proprietary probability model
-
Sharp book market consensus
...that's extra confidence the edge is real.
Key Columns
In addition to the model metrics, you'll see:
-
Market Fair Value - Fair odds based on sharp book consensus (same as Value Finder)
-
Market EV - Expected value using market consensus
-
Blended EV - Conservative blend weighting both signals (leans toward the lower value)
-
Blended Kelly - Conservative combined Kelly recommendation
When to Use Double Edge
-
When you want the highest-confidence opportunities
-
When you prefer extra validation before betting
-
When you want to be more selective about which model plays to take
Best Practices for Model Projections
Compare Multiple Signals
The power of this dashboard is having multiple views:
-
Check Player Projections for raw model numbers and Monte Carlo probabilities
-
Look at Game Projections for team-level matchup context
-
Review Game Logs to validate recent form
-
See MKB Model Opps for model-identified edge
-
Prioritize 💎 Double Edge when model + market agree
Use Monte Carlo Probabilities Wisely
The threshold probabilities are powerful but remember:
-
They're based on simulations, not certainty
-
Variance is real - a 60% probability still misses 40% of the time
-
Use them to compare to book implied probabilities, not as standalone predictions
Cross-Reference with Game Logs
Before taking a model opportunity:
-
Check recent game logs - is the player's form supporting the projection?
-
Look for trends the model might not capture (injury recovery, role changes, recent call-ups)
Trust But Verify
Our model is data-driven but imperfect. Use projections as a starting point, then apply your own judgment on factors the model might not capture (breaking news, lineup changes, etc.).
Part 2: The Model Profitability Dashboard
What is the Model Profitability Dashboard?
The Model Profitability Dashboard tracks actual results from opportunities that appeared on the Model Projections Dashboard. Every model-identified opportunity is logged, and when the game finishes, we calculate whether the bet hit or missed and compute profit/loss.
In simple terms: it shows you how our model is actually performing.
This dashboard answers the critical question: "Is the model finding real edge, or is it just theoretical?"
Understanding Deduplication
Before diving into the dashboard, understand how bets are counted - this is critical for interpreting results correctly.
The Problem: Multiple Snapshots
The Model Projections runs multiple times per day. The same opportunity might appear 5, 10, or more times with slightly different odds and Kelly recommendations as the market moves.
If we counted every snapshot, results would be inflated in both directions.
Our Solution: Tiered Selection
We count each unique opportunity exactly once, using a tiered selection strategy:
A unique opportunity is defined by:
-
Player name
-
Market type
-
Side (over/under)
-
Line value
-
Game date
Which occurrence do we use?
-
Tier 1: First occurrence where Model Kelly ≥ 0.20 units
-
Tier 2: First occurrence where Model Kelly > 0 (if no Tier 1 match)
Opportunities with zero Kelly across all occurrences are EXCLUDED entirely. If the model never saw edge on a bet, it's not counted in results - because it was never a true model opportunity.
Why This Matters
-
Zero-Kelly bets are excluded - they inflate bet counts without representing real opportunities
-
Each bet is counted once with the Kelly stake from the selected occurrence
-
This aligns with how users actually bet - you wouldn't take a 0 Kelly bet
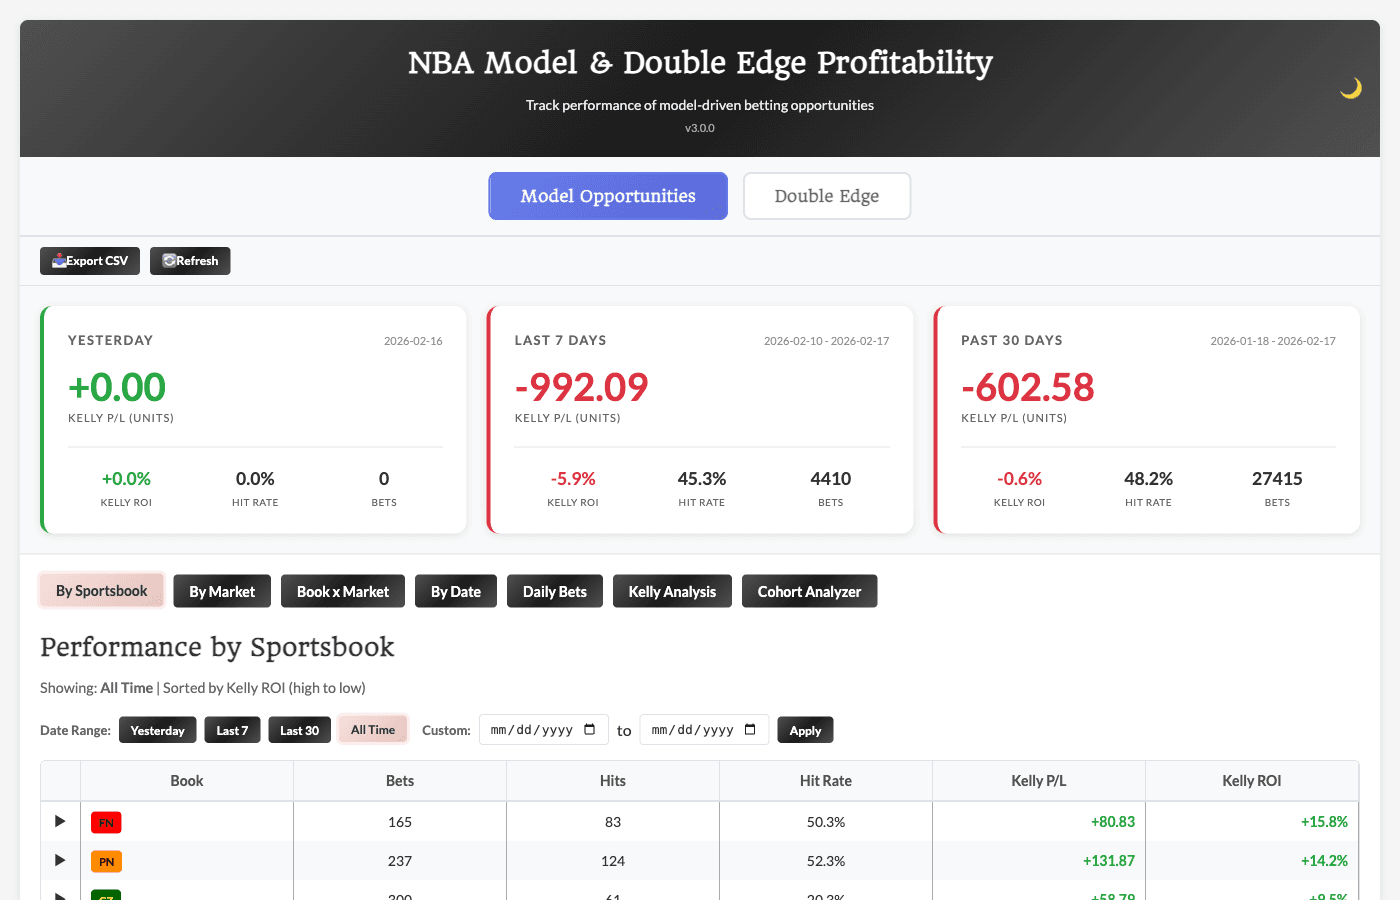
The Summary Cards
At the top, three summary cards give you the big picture:
Yesterday, Last 7 Days and Last 30 Days
Results for the specified period:
-
Bets - Total unique opportunities tracked
-
Hit Rate - Percentage of bets that won
-
Kelly P/L - Profit/loss using Kelly-weighted stakes
-
Kelly ROI - Return on investment
Navigating the Dashboard Tabs
The dashboard has multiple analysis views:
By Sportsbook Tab
Performance broken down by which book had the best odds for each bet.
Key columns:
-
Book - The sportsbook
-
Bets - Number of opportunities where this book had best odds
-
Hits/Misses - Win/loss counts
-
Hit % - Win percentage
-
Kelly P/L - Profit/loss using model Kelly stakes
-
Kelly ROI - Return on investment
Click any row to expand and see that book's market breakdown.
By Market Tab
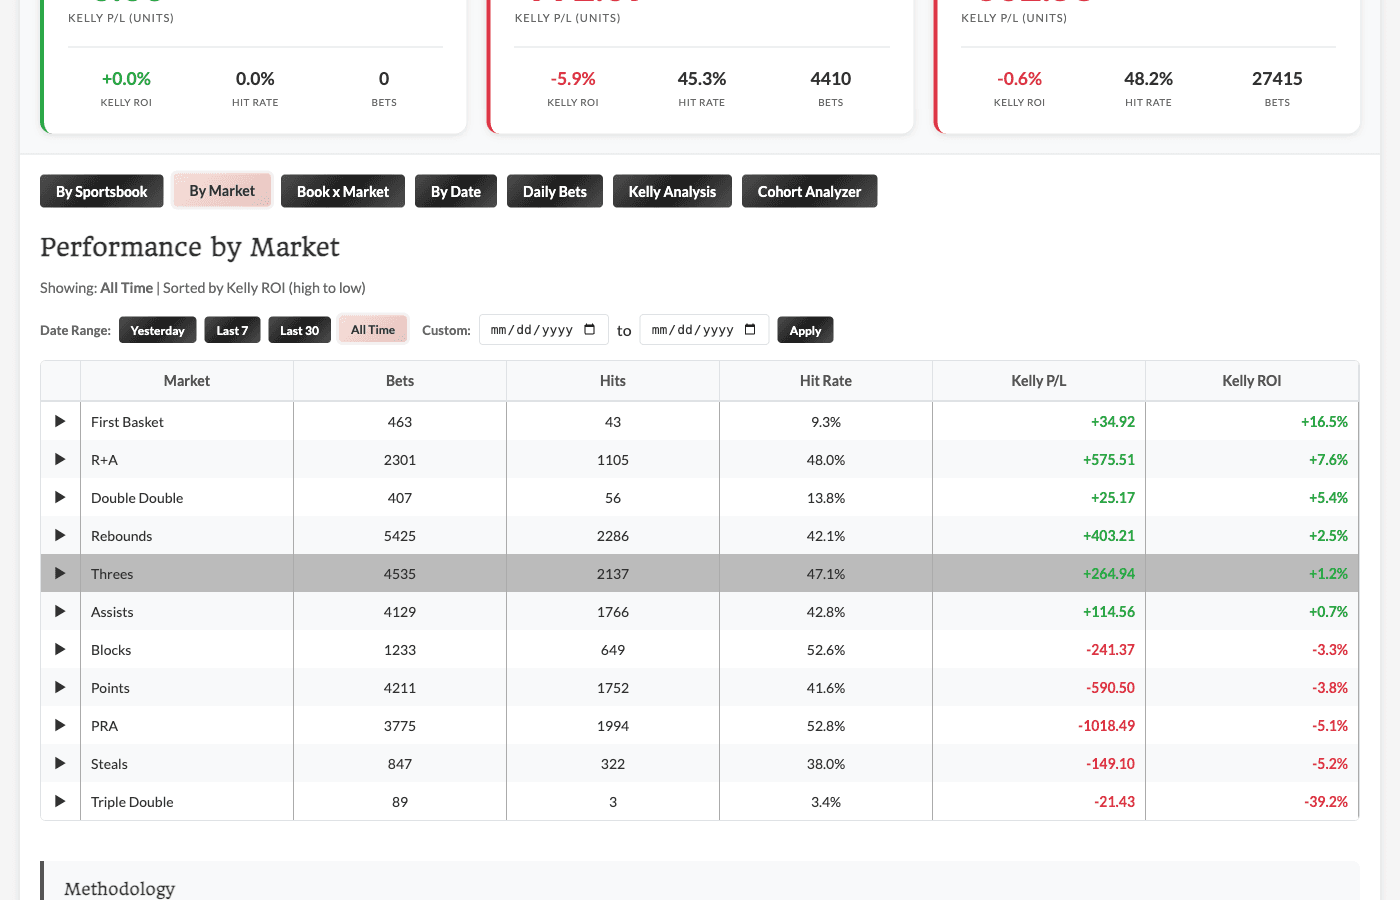
Performance broken down by prop type.
Same columns as By Sportsbook, but grouped by market. Click to expand and see which books perform best for each market type.
By Date Tab
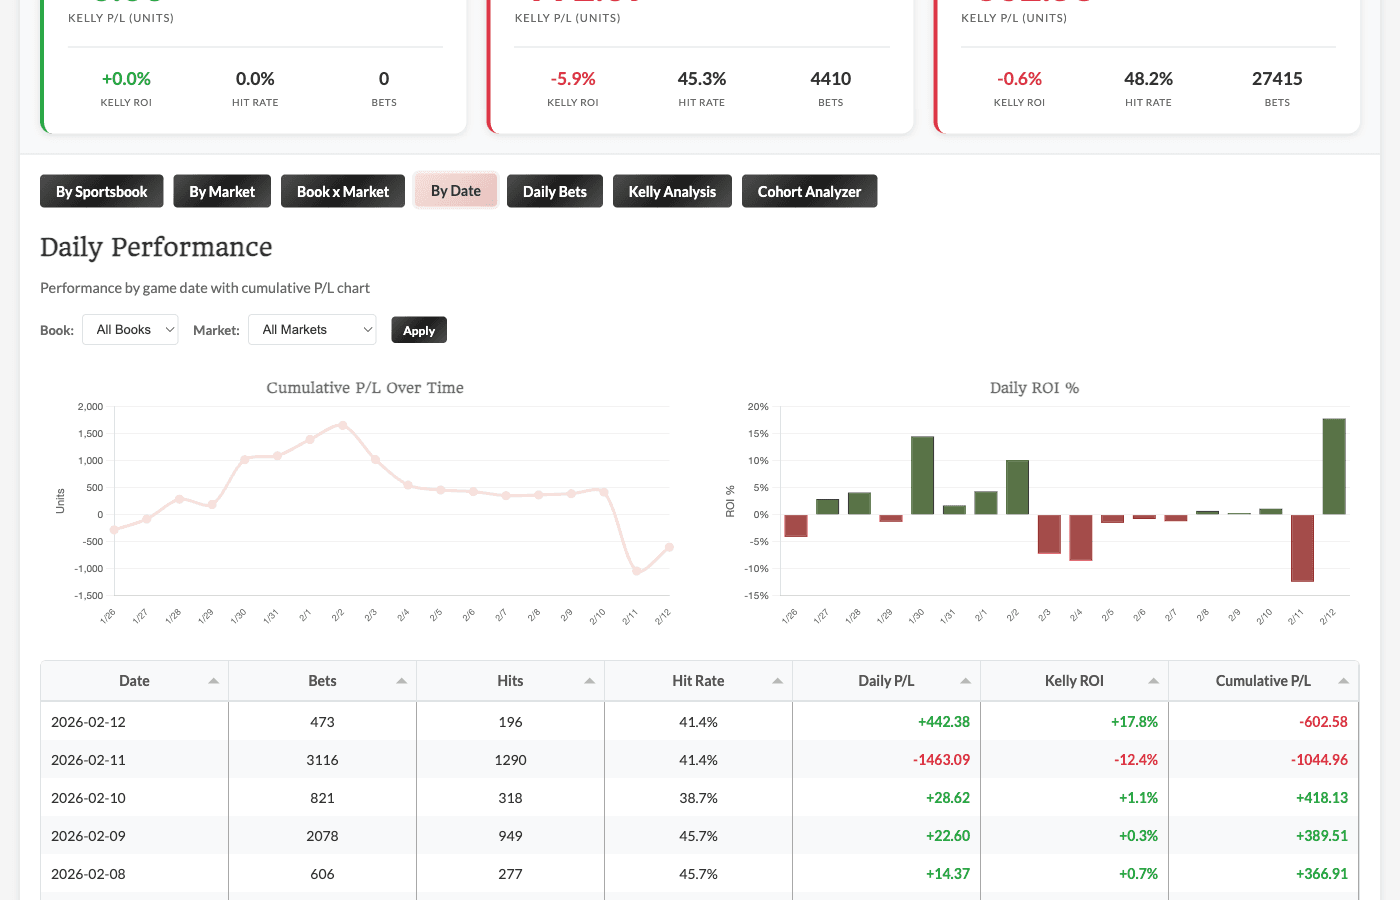
Daily performance with cumulative tracking:
-
Cumulative P/L Chart - Running total trajectory over time
-
Daily ROI Chart - Bar chart showing daily variance (green = positive, red = negative)
-
Daily Table - Detailed breakdown with running totals
Daily Bets Tab
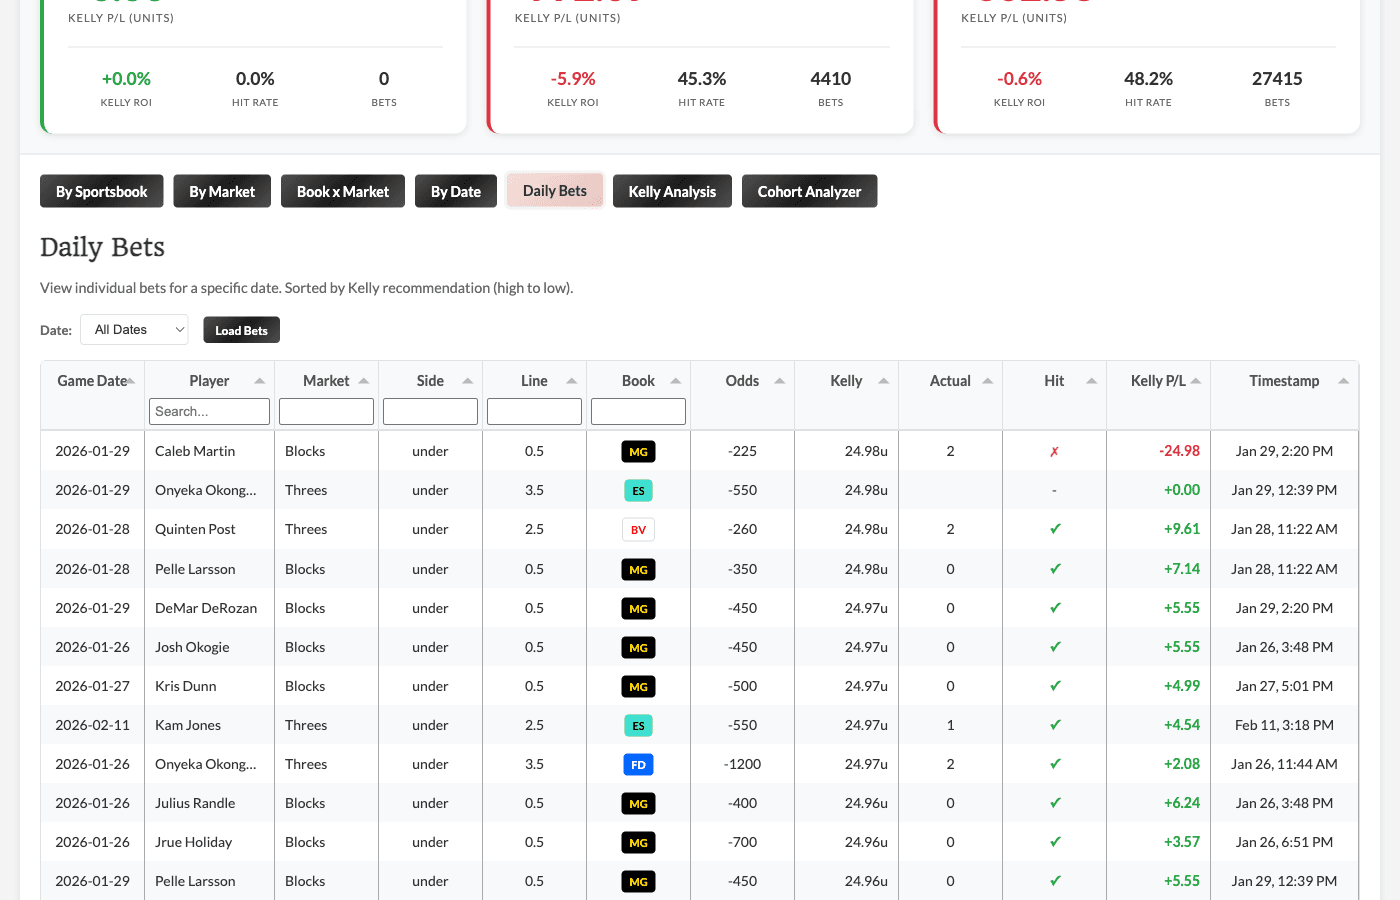
Drill into individual bets for any specific date.
How to use:
-
Select a date from the dropdown
-
Click "Load Bets"
-
View every individual opportunity from that day
Columns include:
-
Game Date - The date of the game
-
Player, market, line, side details
-
Best book and odds
-
Model Kelly stake
-
Actual stat value
-
Hit/miss status
-
Kelly P/L
-
Timestamp - When the selected occurrence was captured (so you know which run was used)
Kelly Analysis Tab
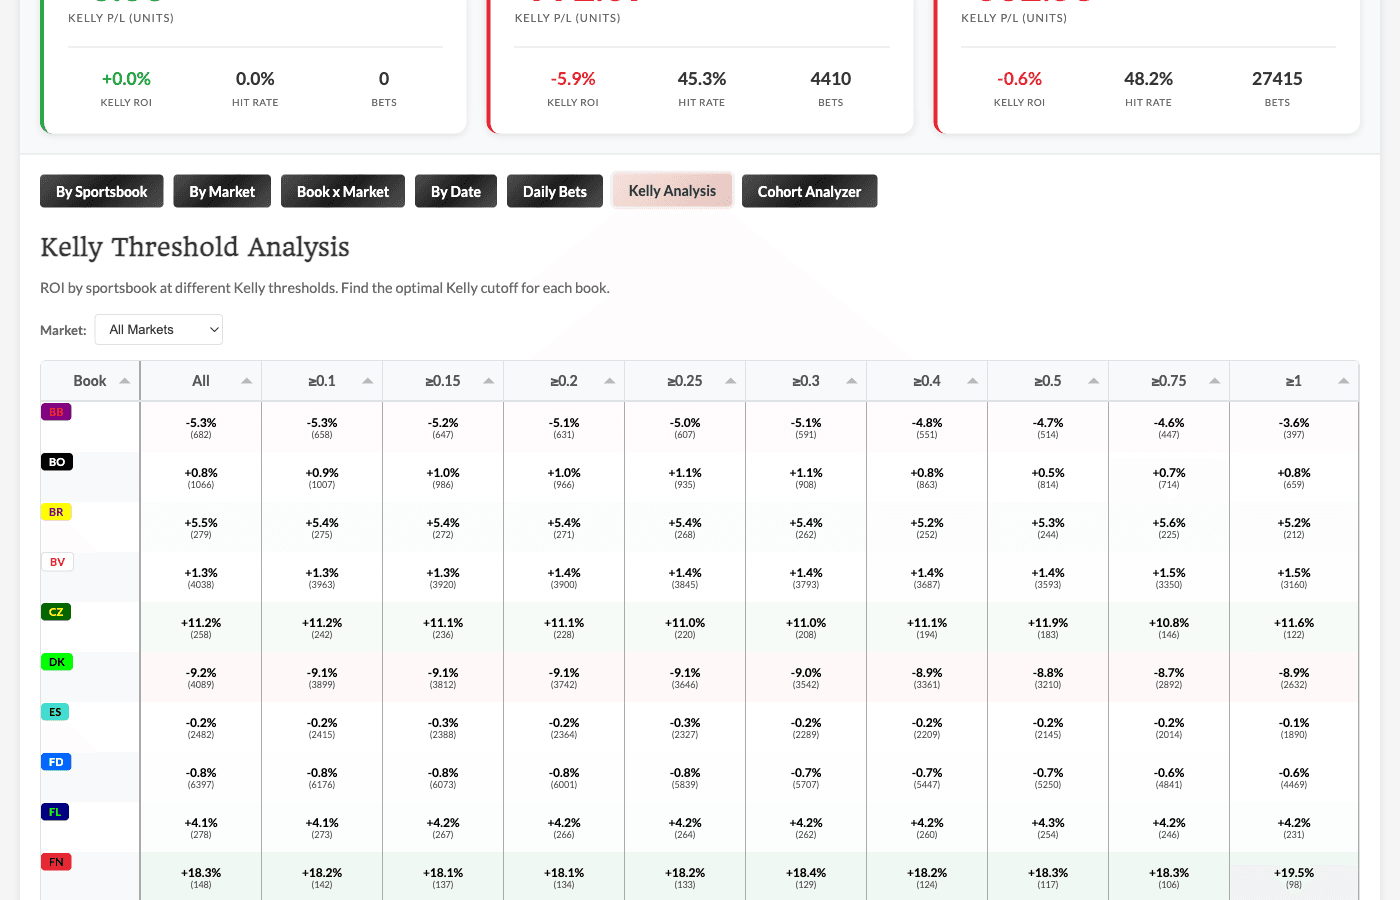
ROI by sportsbook at different Kelly thresholds. This helps identify optimal minimum Kelly cutoffs.
How to read:
-
Rows = Sportsbooks
-
Columns = Kelly thresholds (≥0.1, ≥0.2, ≥0.5, etc.)
-
Each cell shows: ROI% (number of bets)
What this tells you: Some books might only be profitable at higher Kelly thresholds. This helps you identify patterns like "Book X only shows positive ROI at ≥0.5u".
Cohort Analyzer Tab
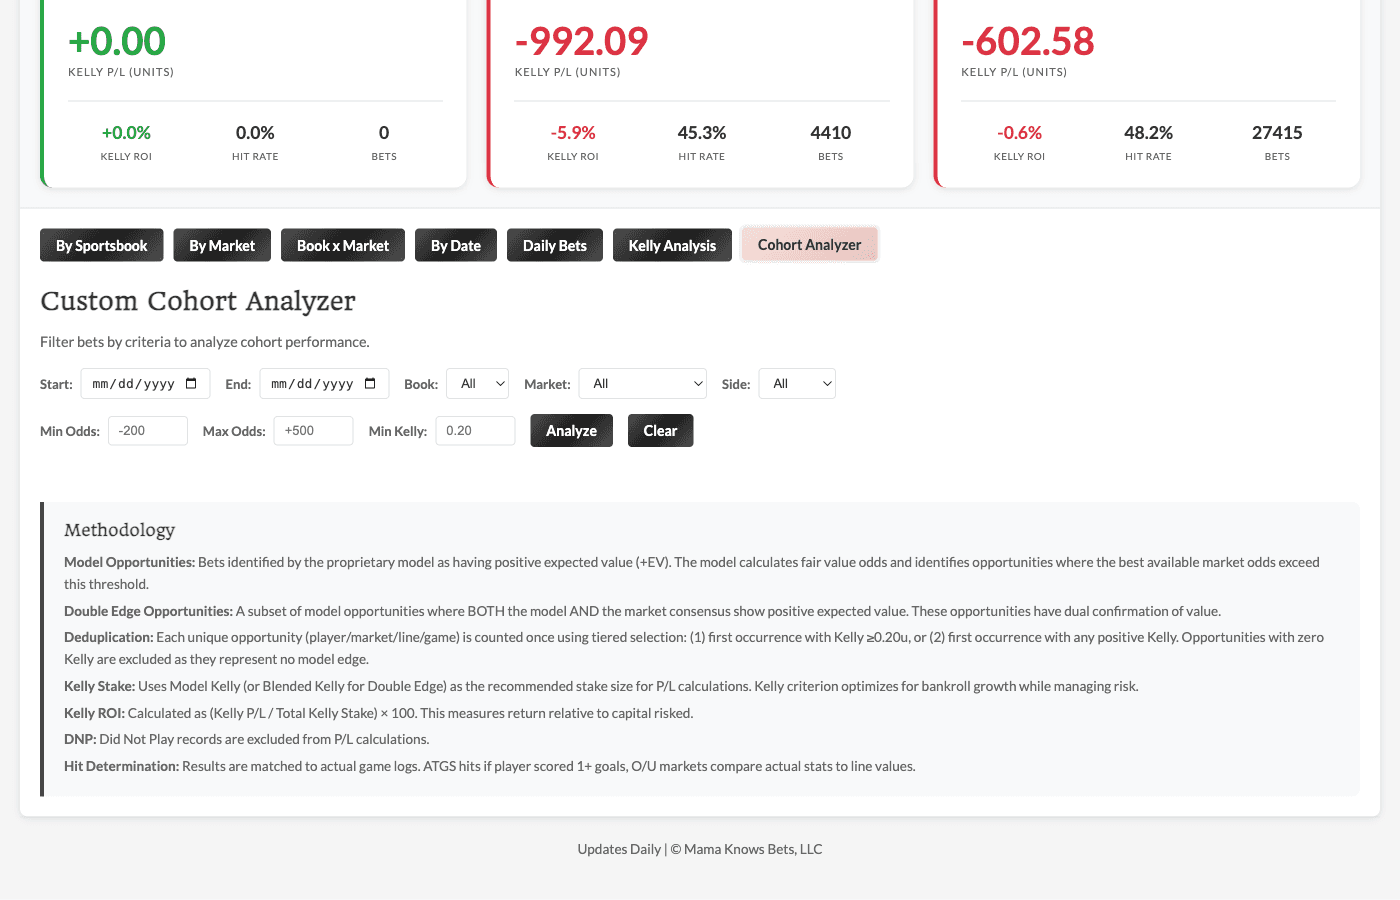
Build custom queries to analyze specific subsets of bets.
Available filters:
-
Date range
-
Sportsbook
-
Market type
-
Side (over/under)
-
Min/max odds range
-
Min Kelly threshold
Use cases:
-
"How did FanDuel Points overs perform last month?"
-
"What's the ROI on high-Kelly (≥0.5u) bets?"
-
"Are unders outperforming overs across markets?"
Using the Filters
Date Range Buttons
Available on most tabs:
-
All Time - Full tracking period
-
Yesterday - Most recent game day
-
Last 7 - Rolling 7 days
-
Last 30 - Rolling 30 days
Plus custom date range pickers for specific periods.
Interpreting the Results
What's a Good ROI?
In sports betting, even 2-5% ROI over a large sample is excellent. 10%+ is exceptional.
Remember: these are results from an automated model, not cherry-picked winners.
Sample Size Matters
A book/market combo with 10 bets at +50% ROI is interesting but not conclusive. The same combo with 500+ bets at +10% ROI is much more meaningful.
Variance is Real
You'll see losing days and losing weeks. That's normal. The math plays out over hundreds and thousands of bets.
The By Date cumulative chart helps you see the long-term trajectory through the noise.
Comparing Model vs Double Edge
If you're using both tabs, compare their performance:
-
Model-only opportunities: Based purely on our probability estimates
-
Double Edge: Where model AND market agree
If Double Edge consistently outperforms Model-only, it suggests using market confirmation adds value.
How We Use This Data
The Model Profitability Dashboard isn't just for transparency - we actively use it to improve:
Model Refinement
When we see patterns in results:
-
Markets where the model underperforms → investigate and retrain
-
Markets where the model excels → lean into those opportunities
-
Book-specific patterns → adjust how we weight certain books in opportunity ranking
Weight Updates
When specific books consistently show positive or negative ROI:
-
Positive ROI = that book's lines are exploitable (soft)
-
Negative ROI = that book is sharper than expected - be cautious or avoid
We don't make reactive changes based on short-term results - updates require sufficient sample size and consistent patterns.
Model Projections vs Value Finder: When to Use Which
Both tools find +EV opportunities, but they work differently:
Use the Value Finder When:
-
You want consensus-driven fair value (what the sharp market thinks)
-
You prefer more conservative, well-established methodology
-
You want the Confidence-Adjusted Kelly that accounts for market coverage
-
You want to view Player Projection Info as a tooltip alongside your market view
Use Model Projections When:
-
You want to bet on our proprietary probability estimates
-
You're looking for opportunities the market might be missing
-
You want to diversify your edge sources beyond market consensus
-
You want to be able to sort and/or filter on player projection data (position, matchup, etc)
Use Double Edge (Model Projections) When:
-
You want extra confirmation - both model AND market see edge
-
You prefer the highest-confidence opportunities
-
You want to be more selective about which model opportunities to take
Using Both Together
Many users combine both tools:
-
Check the Value Finder for market consensus opportunities
-
Check Model Projections for model-driven opportunities
-
Prioritize bets that appear on both (or on Double Edge)
-
Use the respective Results/Profitability dashboards to track performance
Quick Reference
Model Projections - What to Look For
-
High Model Kelly - Strong conviction from the model
-
Double Edge opportunities - Model AND market agree
-
Reasonable odds - Not just longshots (unless you want those)
-
Verify odds are still available - Always check before betting
Model Profitability - What to Check
Daily:
-
Summary cards for quick P/L snapshot
-
Daily Bets tab after games complete
Weekly:
-
By Sportsbook for book performance
-
By Market for prop type performance
-
Kelly Analysis for threshold patterns
Monthly:
-
By Date cumulative trend
-
Cohort Analyzer for deep dives
-
Compare Model vs Double Edge performance
Red Flags to Watch
-
Consistent underperformance at specific books
-
A market type bleeding losses
Questions?
The Model Projections update throughout the day, and the Model Profitability Dashboard updates the following day. Check back regularly to see opportunities and track performance!
If you have questions about the methodology or want to discuss patterns, drop them in Discord!
Ready to explore? Head to the Model Projections Dashboard (NHL or NBA) to find opportunities, then check the Model Profitability Dashboard (NHL or NBA) to see how they've performed historically.
Finding value matters.
Unlock our full suite of tools and join a community of sharp bettors.
- All Value Finders
- Projection models & sims
- Full Discord access
- MLB, WNBA, Golf, Soccer, NFL, NBA & NHL
- Data export
Starting at $20/month — 14-day money-back guarantee
Join MKB VIP