How To Use the Value Finder Results Dashboard: A Complete Guide
December 14, 2025
This guide will help you understand how to interpret our Value Finders Results Dashboard. To learn more about the Value Finders themselves, head to How To Use the Value Finders: A Complete Guide.
What is the Results Dashboard?
The NBA Value Finder Results Dashboard is your window into how our Value Finder picks are actually performing. Every betting opportunity that appears on the Value Finder is tracked, and when the game finishes, we calculate whether the bet hit or missed and compute the profit/loss.
In simple terms: it shows you the receipts.
This isn't a theoretical backtest - it's real results from real opportunities that appeared on the tool, tracked daily (updating around 10-11am ET each day for the results from the prior day).
Not interested in the data? No problem. You don't need to engage with this dashboard at all to benefit from the Value Finders! The tool works the same way regardless - you can keep taking high-value opportunities as they appear and trust that results are being tracked behind the scenes. We use this data to identify what's working, refine book weights, and continuously improve the Value Finder. So if you never open this dashboard, that's completely fine - the improvements still flow into the tool you're already using. But when you're ready to dig deeper, the data is here waiting.
Why We Built This
Transparency matters. When we tell you a tool finds +EV opportunities, you should be able to verify that claim with real data. The Results Dashboard lets you:
-
See actual performance - Not projections, actual P/L
-
Identify what's working - Which books? Which markets? Which combinations?
-
Validate methodology changes - When we update book weights, you can see the data that drove those decisions
-
Build confidence - Trust the process by watching the math play out over time
Understanding Deduplication: Why This Matters
Before diving into the dashboard, you need to understand how we count bets - because this is critical to interpreting the results correctly.
The Problem: Multiple Snapshots Per Bet
The Value Finder scans for opportunities every ~20 minutes during peak hours. That means the same betting opportunity might appear on the Value Finder 5, 10, or even 20+ times before the game starts.
If we counted every snapshot as a separate bet, our results would be massively inflated - both wins AND losses would be overcounted.
Our Solution: Tiered Selection
We use a tiered selection strategy that counts each unique betting opportunity exactly once, choosing the most representative snapshot for each bet.
A unique opportunity is defined by:
-
Player name
-
Market type (e.g., player_points)
-
Side (over/under)
-
Line value (e.g., 24.5)
-
Game (to handle doubleheaders)
Which occurrence do we use? We use a tiered approach that prioritizes quality signals:
Tier 1 (Highest Quality): The first occurrence where:
-
Confidence-Adjusted Kelly is ≥ 0.20 units, AND
-
Market coverage is 5+ books
Tier 2 (Good Coverage): If no Tier 1 match, the first occurrence where:
- Market coverage is 5+ books (any Kelly value)
Tier 3 (Fallback): If no Tier 2 match, the median occurrence by timestamp.
Why This Tiered Approach?
The tiered selection reflects how most users actually interact with the tool:
-
Tier 1 captures actionable signals - Most users only take bets at ≥0.20u Kelly. By selecting the first occurrence that meets both the stake threshold AND coverage requirements, we're measuring performance of bets that users would realistically act on.
-
Tier 2 ensures statistical reliability - Fair Value calculations with 5+ books are more stable. If a bet never reached the 0.20u threshold with good coverage, we still want a reliable snapshot.
-
Tier 3 avoids edge case bias - For rare opportunities that never hit 5+ coverage, the median occurrence provides a balanced view rather than picking an extreme point.
What This Means for You
-
Each bet is counted once, not multiple times
-
The Kelly stake used is from the selected occurrence (following the tier logic above)
-
Higher-quality signals (Tier 1) take priority when available
-
This approach aligns with how users actually bet - it measures performance of opportunities you'd realistically take, at the soonest point you’d realistically take them
A Note on Interpretation
This dashboard represents one way to slice the data. The tiered selection strategy we've chosen gives us what we believe is the best directional read on performance - it's realistic (mirrors user behavior), conservative (requires coverage), and prioritizes actionable signals.
That said, use your own discretion when interpreting results. These numbers provide directional guidance, not gospel truth. Consider:
-
Your actual betting behavior might differ - maybe you use a different Kelly threshold or catch opportunities at different times
-
Sample sizes matter - a book/market combo with 50 bets is more meaningful than one with 10
-
Variance is real - short-term results (days, even weeks) can swing wildly from expected value
-
Context matters - a bad stretch might coincide with injuries, roster changes, or market adjustments
Think of this dashboard as a compass, not a GPS. It points you in the right direction but doesn't tell you exactly where to step.
Understanding the Stake Metrics
The dashboard shows two different ways to calculate profit/loss:
Confidence-Adjusted Kelly
This is the primary metric. It uses the Confidence-Adjusted Kelly stake (aka Confidence Adjusted Recommended Unit, or Conf. Adj. Recc. U in the Value Finder) from each bet - the same recommendation you see on the Value Finder.
Remember from the Value Finder guide: Confidence-Adjusted Kelly scales your stake based on how confident we are in the Fair Value calculation. More books reporting = higher confidence = stake closer to the theoretical Kelly. Fewer books = lower confidence = stake scaled down.
This is how we recommend betting, so this is how we track results.
Standard Kelly
This uses the raw Kelly stake without confidence adjustment. It's useful for comparison - you can see whether the confidence adjustment is helping or hurting performance.
In theory, Confidence-Adjusted should protect you from low-coverage false positives. Comparing the two shows whether that's working.
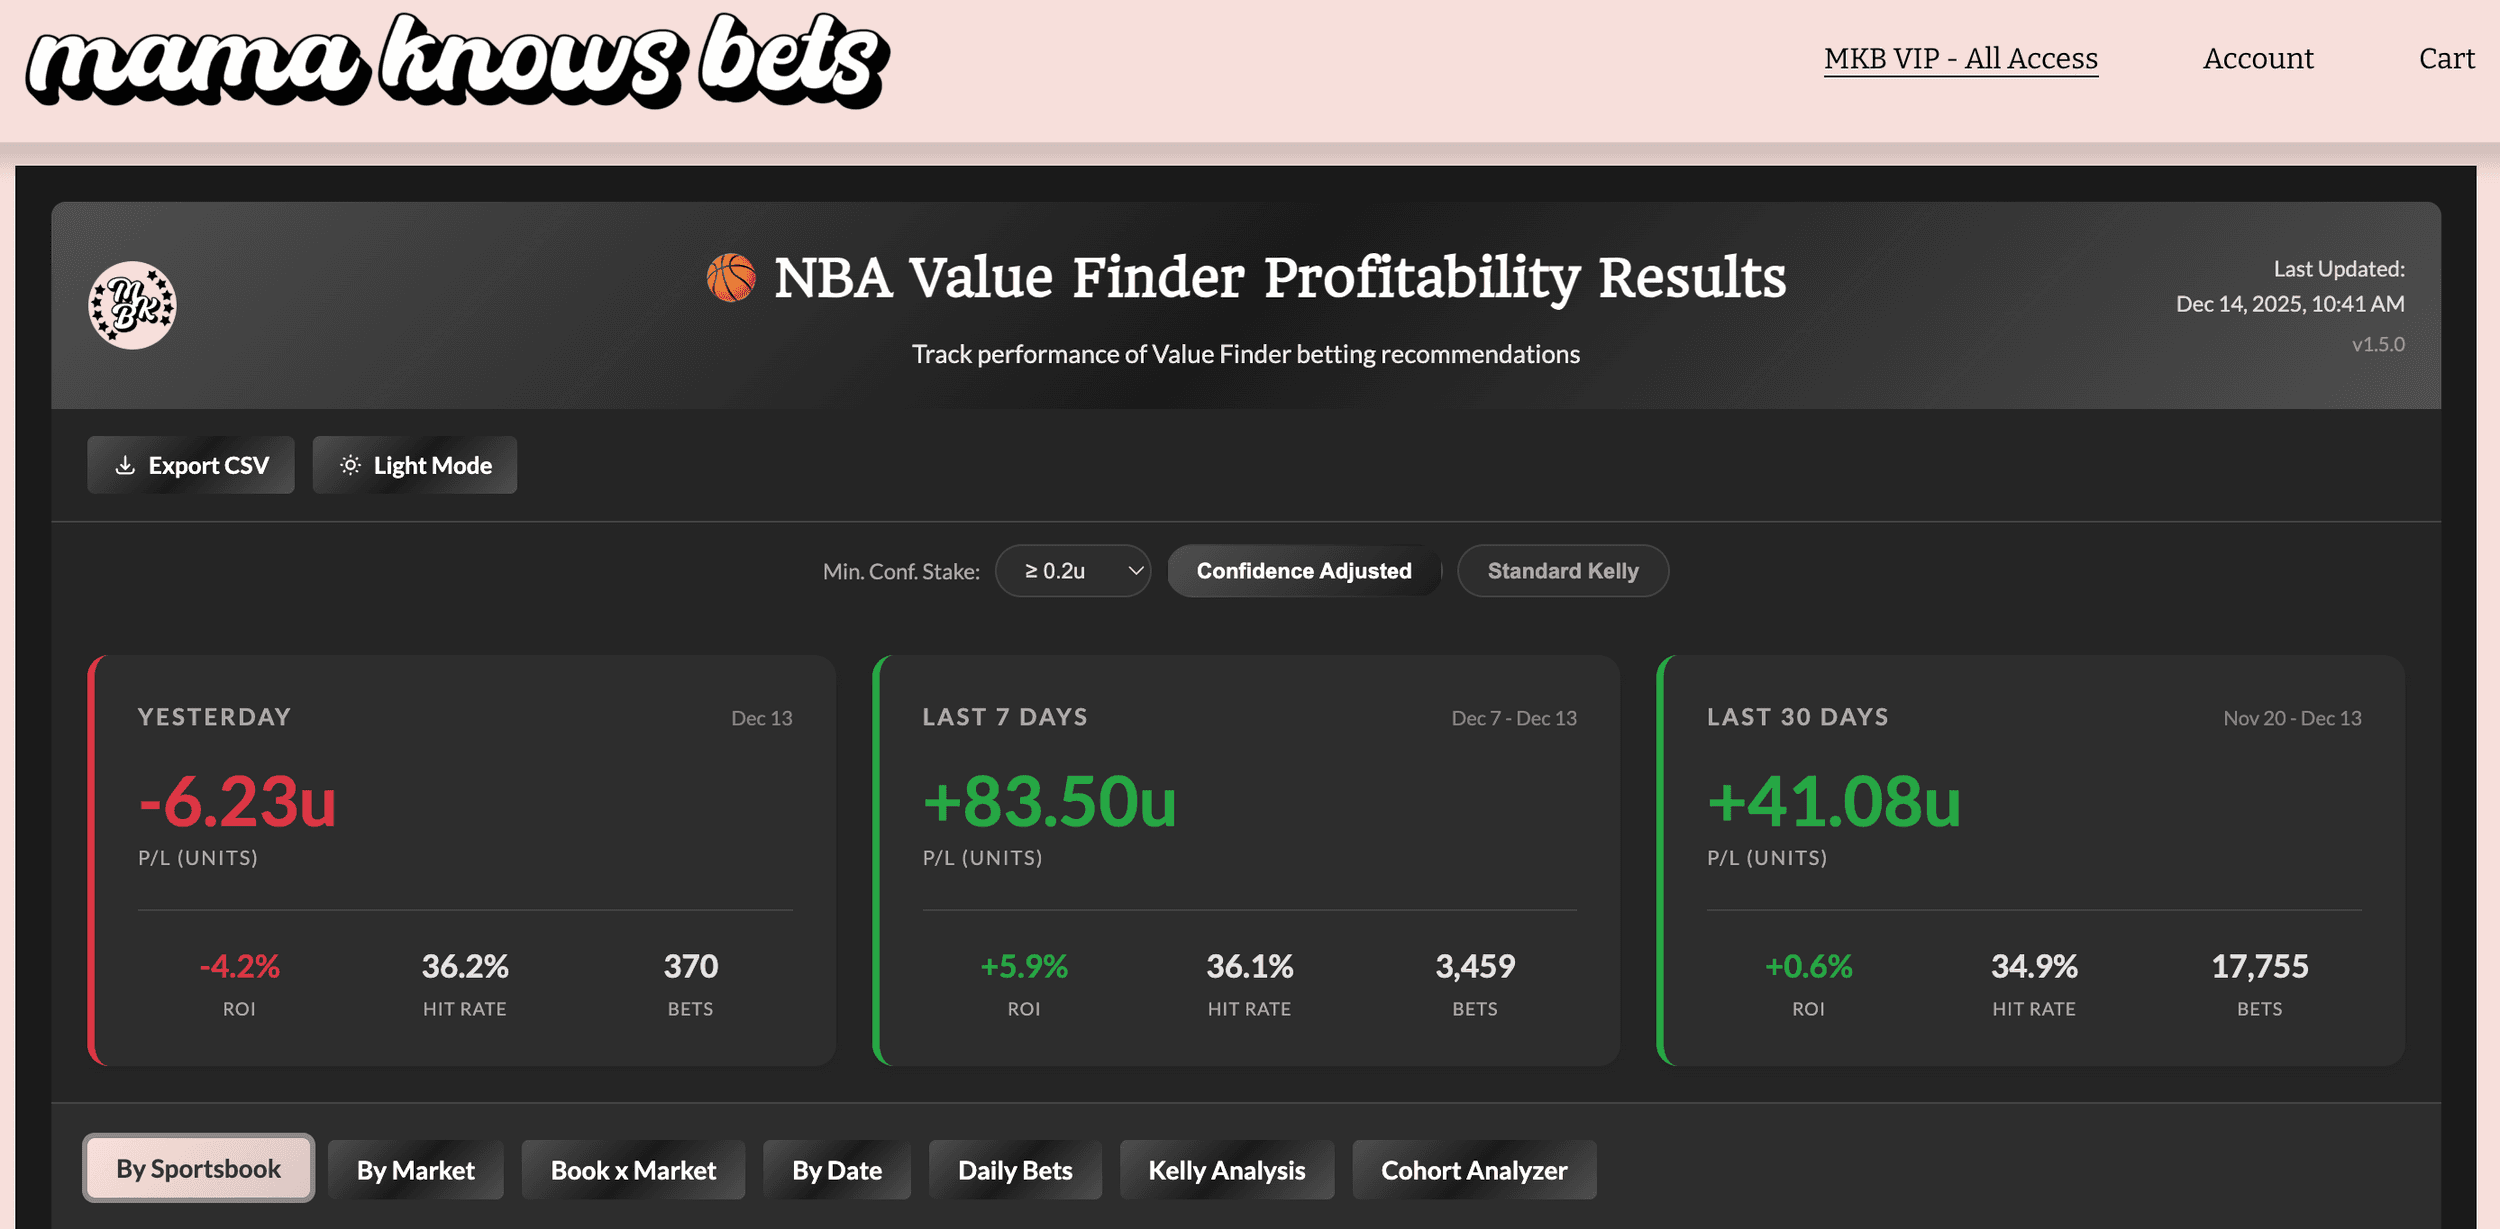
The Summary Cards
At the top of the dashboard, you'll see three summary cards giving you the big picture. Note that these are using the selections of the filter and buttons above: the “Min. Conf. Stake” and either “Confidence Adjusted” or “Standard Kelly”. Swap any of these and watch results change instantly.
Yesterday's Performance
Quick check on how yesterday's opportunities performed. Useful for daily check-ins.
-
P/L - Profit/loss in units
-
ROI - Return on investment (P/L / total staked)
-
Hit Rate - Percentage of bets that won
-
Bets - Number of unique opportunities tracked
Last 7 Days Performance
Rolling week view to smooth out daily variance. Same metrics as yesterday's card.
Last 30 Days Performance
Monthly perspective - long enough to be meaningful, recent enough to reflect current market conditions. Same metrics.
Note: These cards are affected by the global Min. Conf. Stake filter. If you change that filter, the summary cards will update to reflect only bets at or above your selected threshold.
Navigating the Dashboard
The dashboard has eight main views, accessible via tabs:
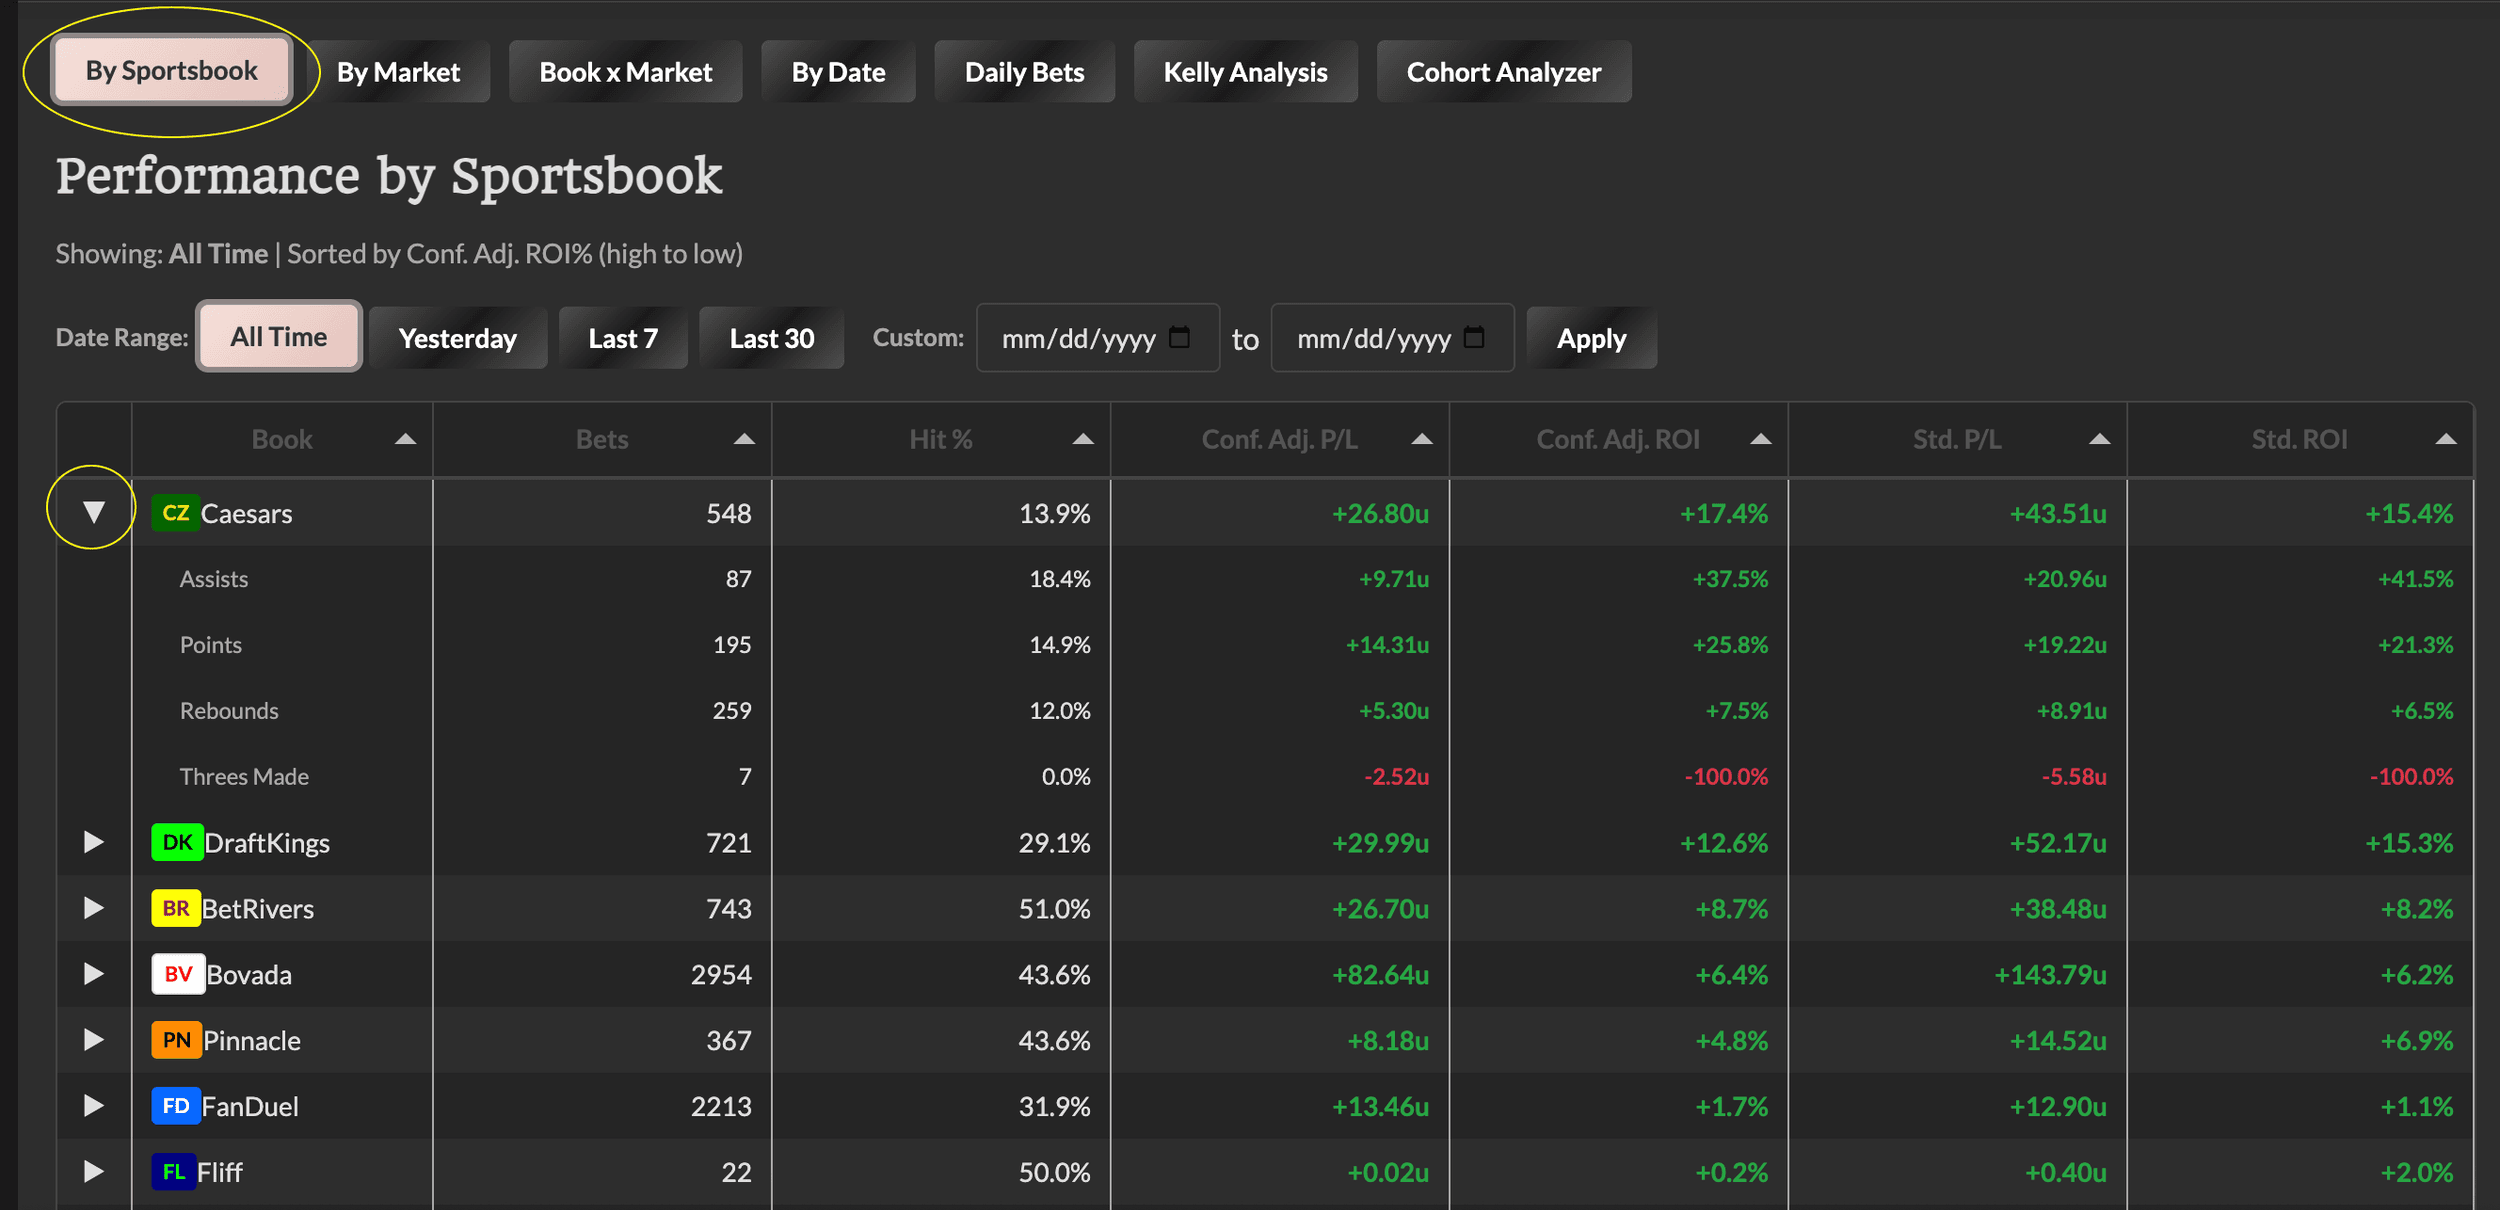
By Sportsbook Tab
Shows performance broken down by which book had the best odds for each bet.
Key columns:
-
Book - The sportsbook
-
Bets - Number of bets where this book had the best odds
-
Hits - Number of winning bets
-
Hit % - Win percentage
-
Conf. Adj. P/L - Profit/loss using confidence-adjusted stakes
-
Conf. Adj. ROI - Return on investment
-
Std. P/L / Std. ROI - Same metrics using standard Kelly
Pro tip: Click any row to expand and see that book's market breakdown. This shows you which prop types are performing best at each book.
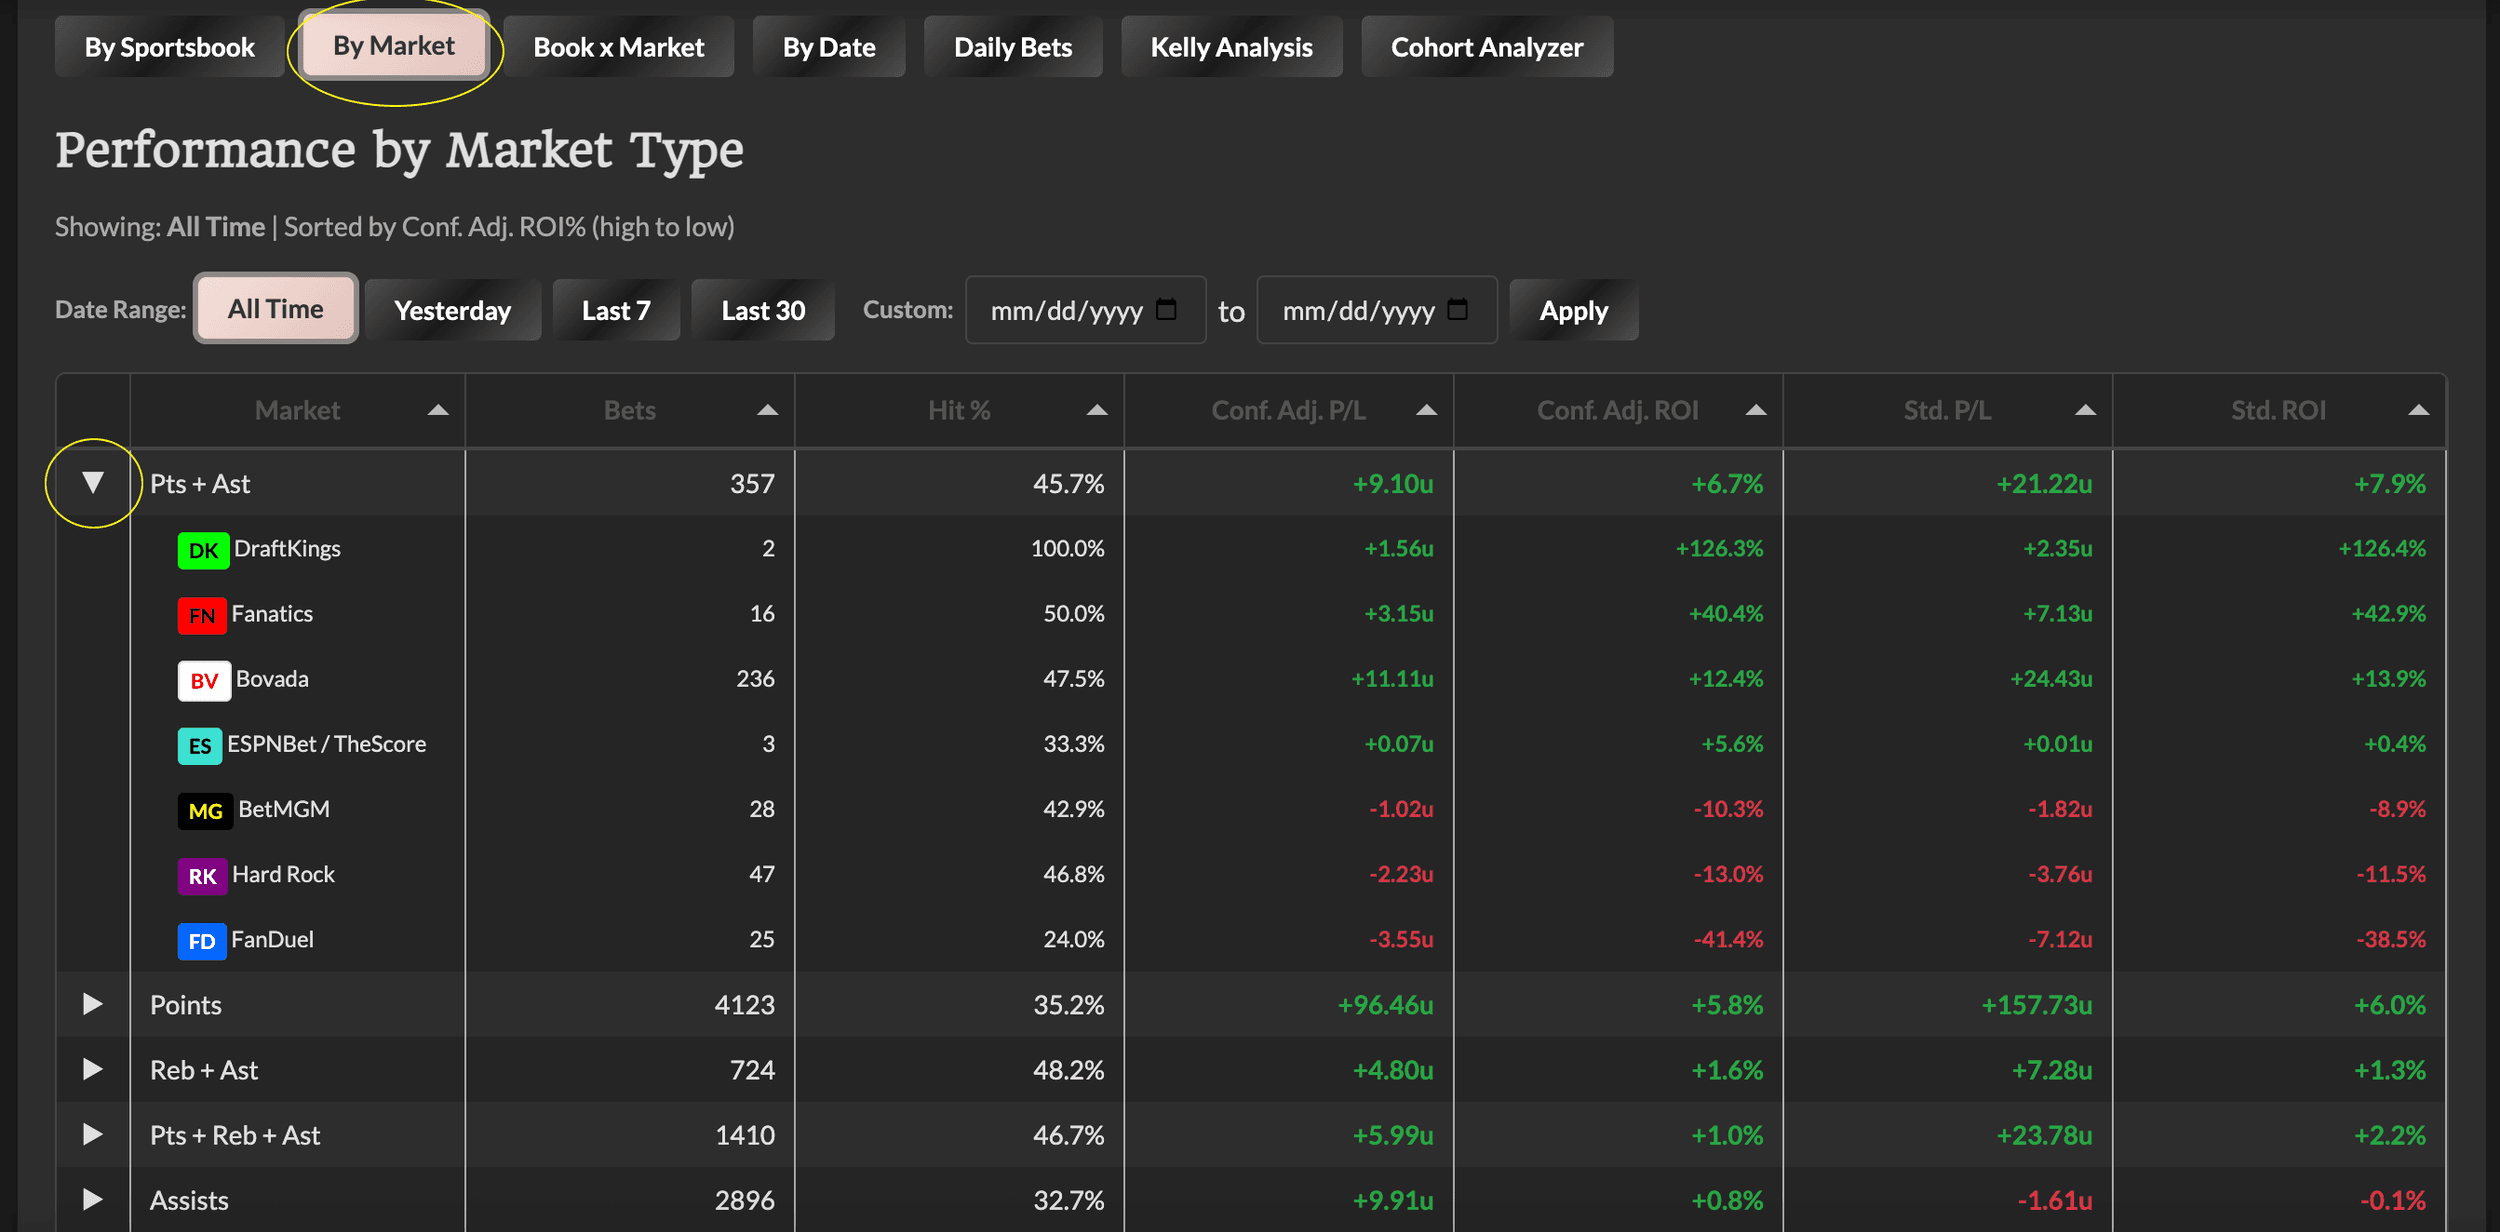
By Market Tab
Shows performance broken down by prop type (points, rebounds, assists, etc.).
Same columns as By Sportsbook, but grouped by market instead.
Pro tip: Click any row to expand and see which books are performing best for that market type.
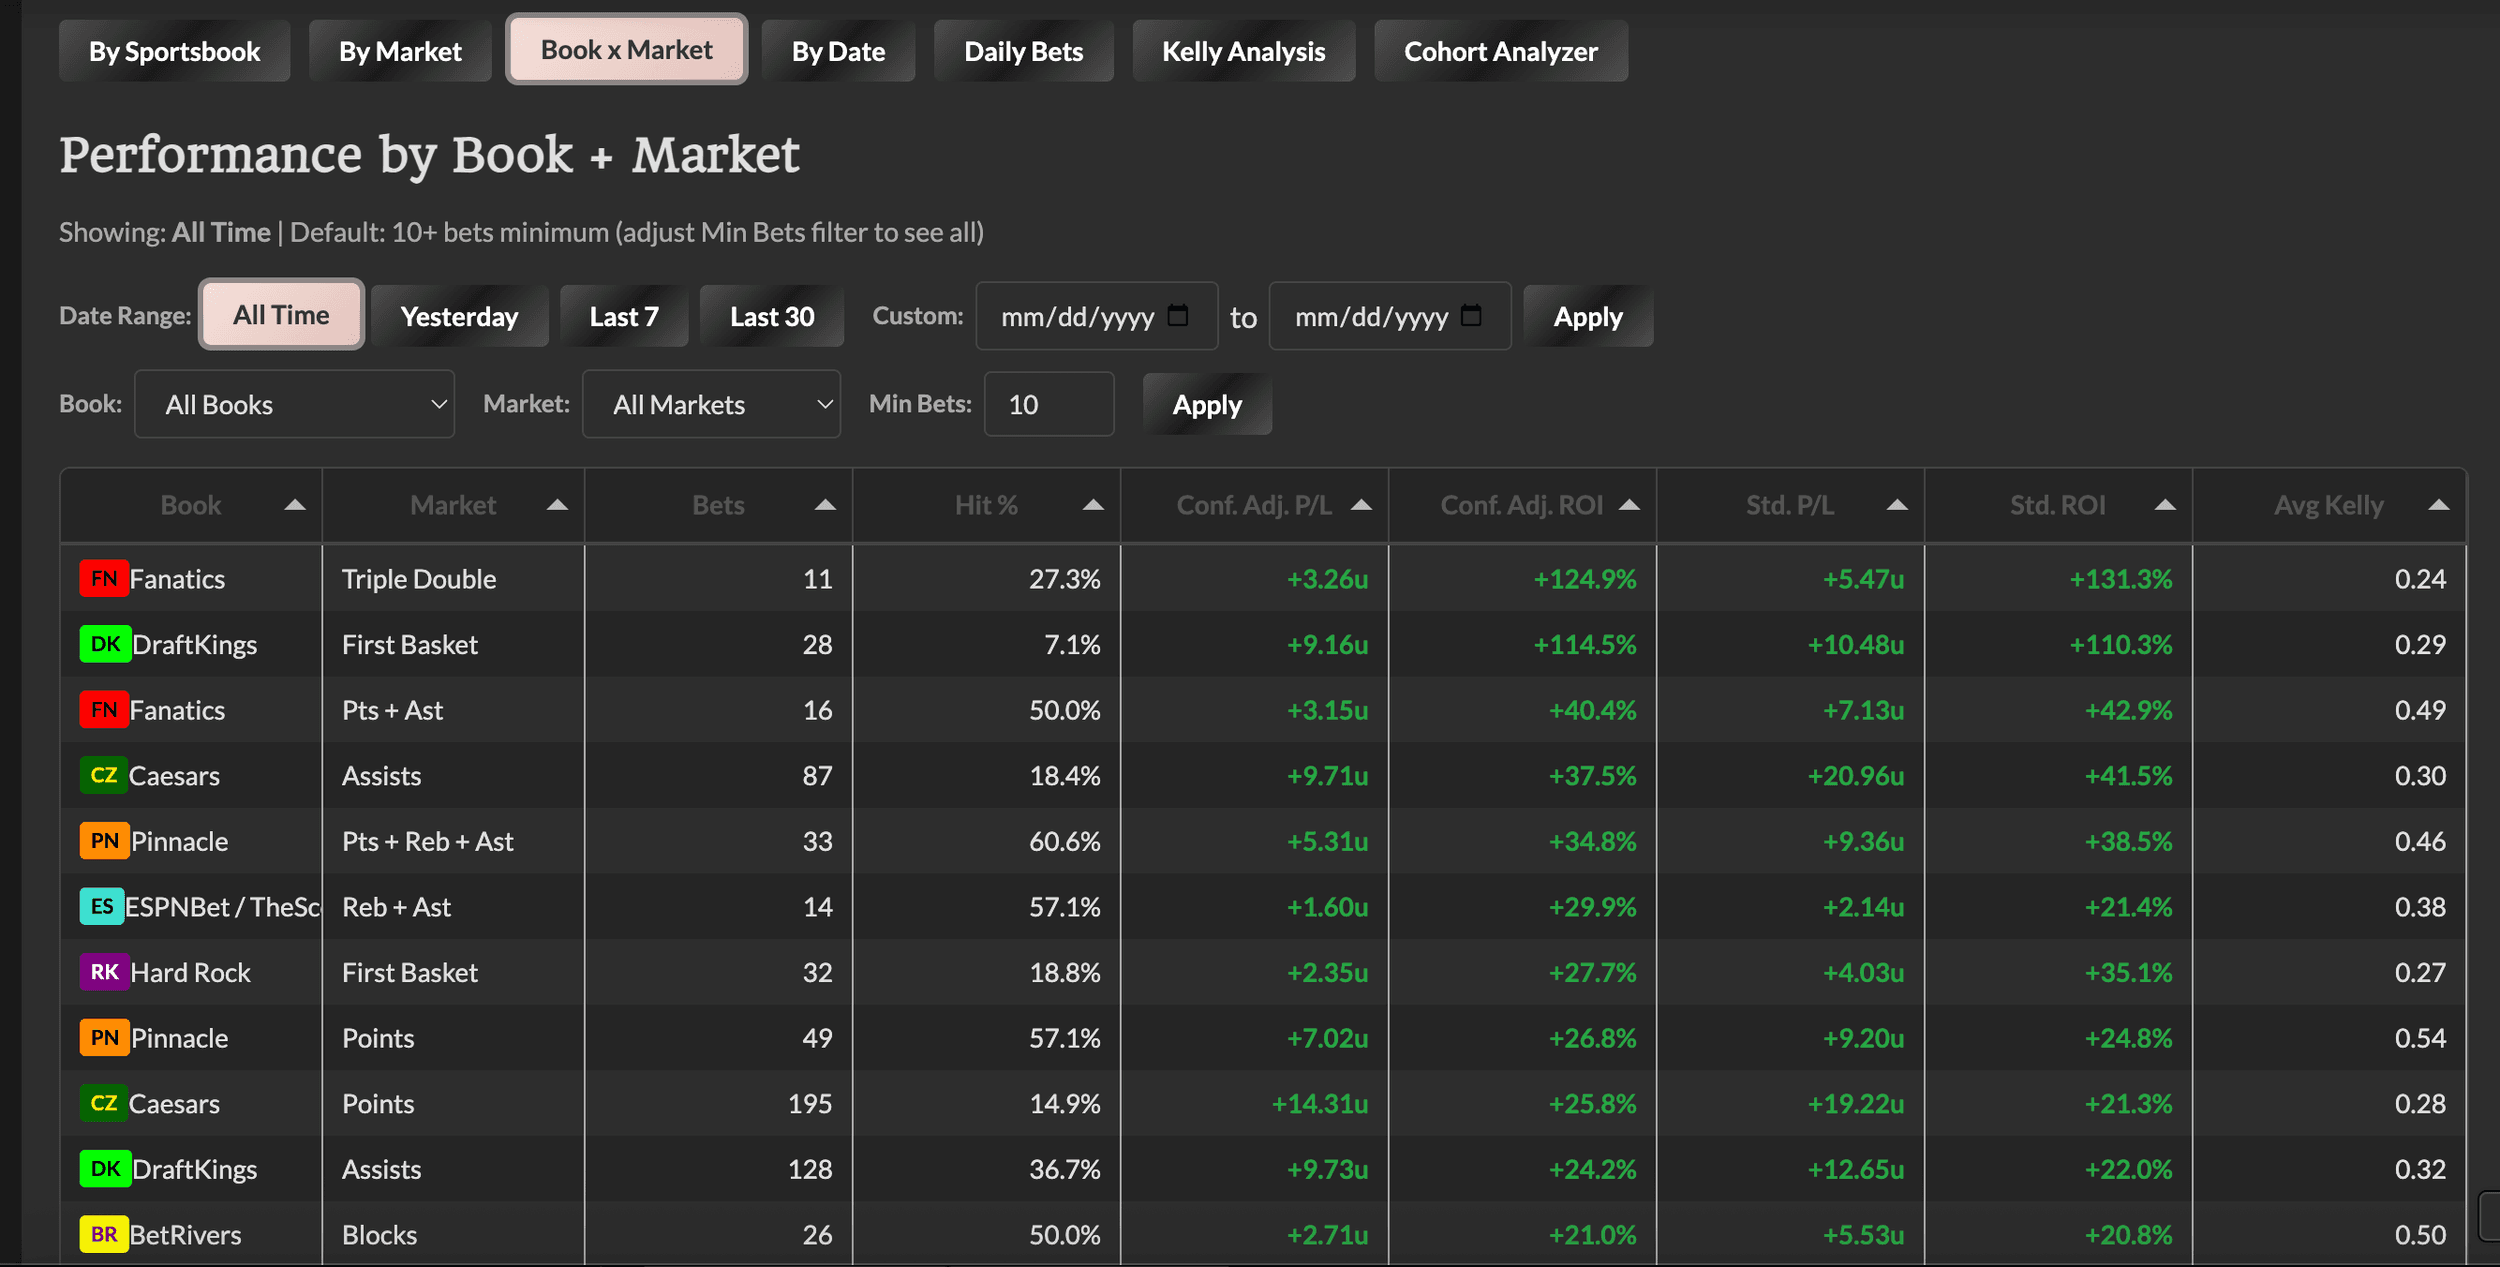
Book x Market Tab
The most granular view - performance for each book + market combination.
This is where you find gems like "FanDuel Points is crushing it" or "BetMGM Threes is underperforming."
Note: By default, this view filters to combinations with 10+ bets. You can change this filter to see all combinations, but smaller sample sizes should be interpreted with caution.
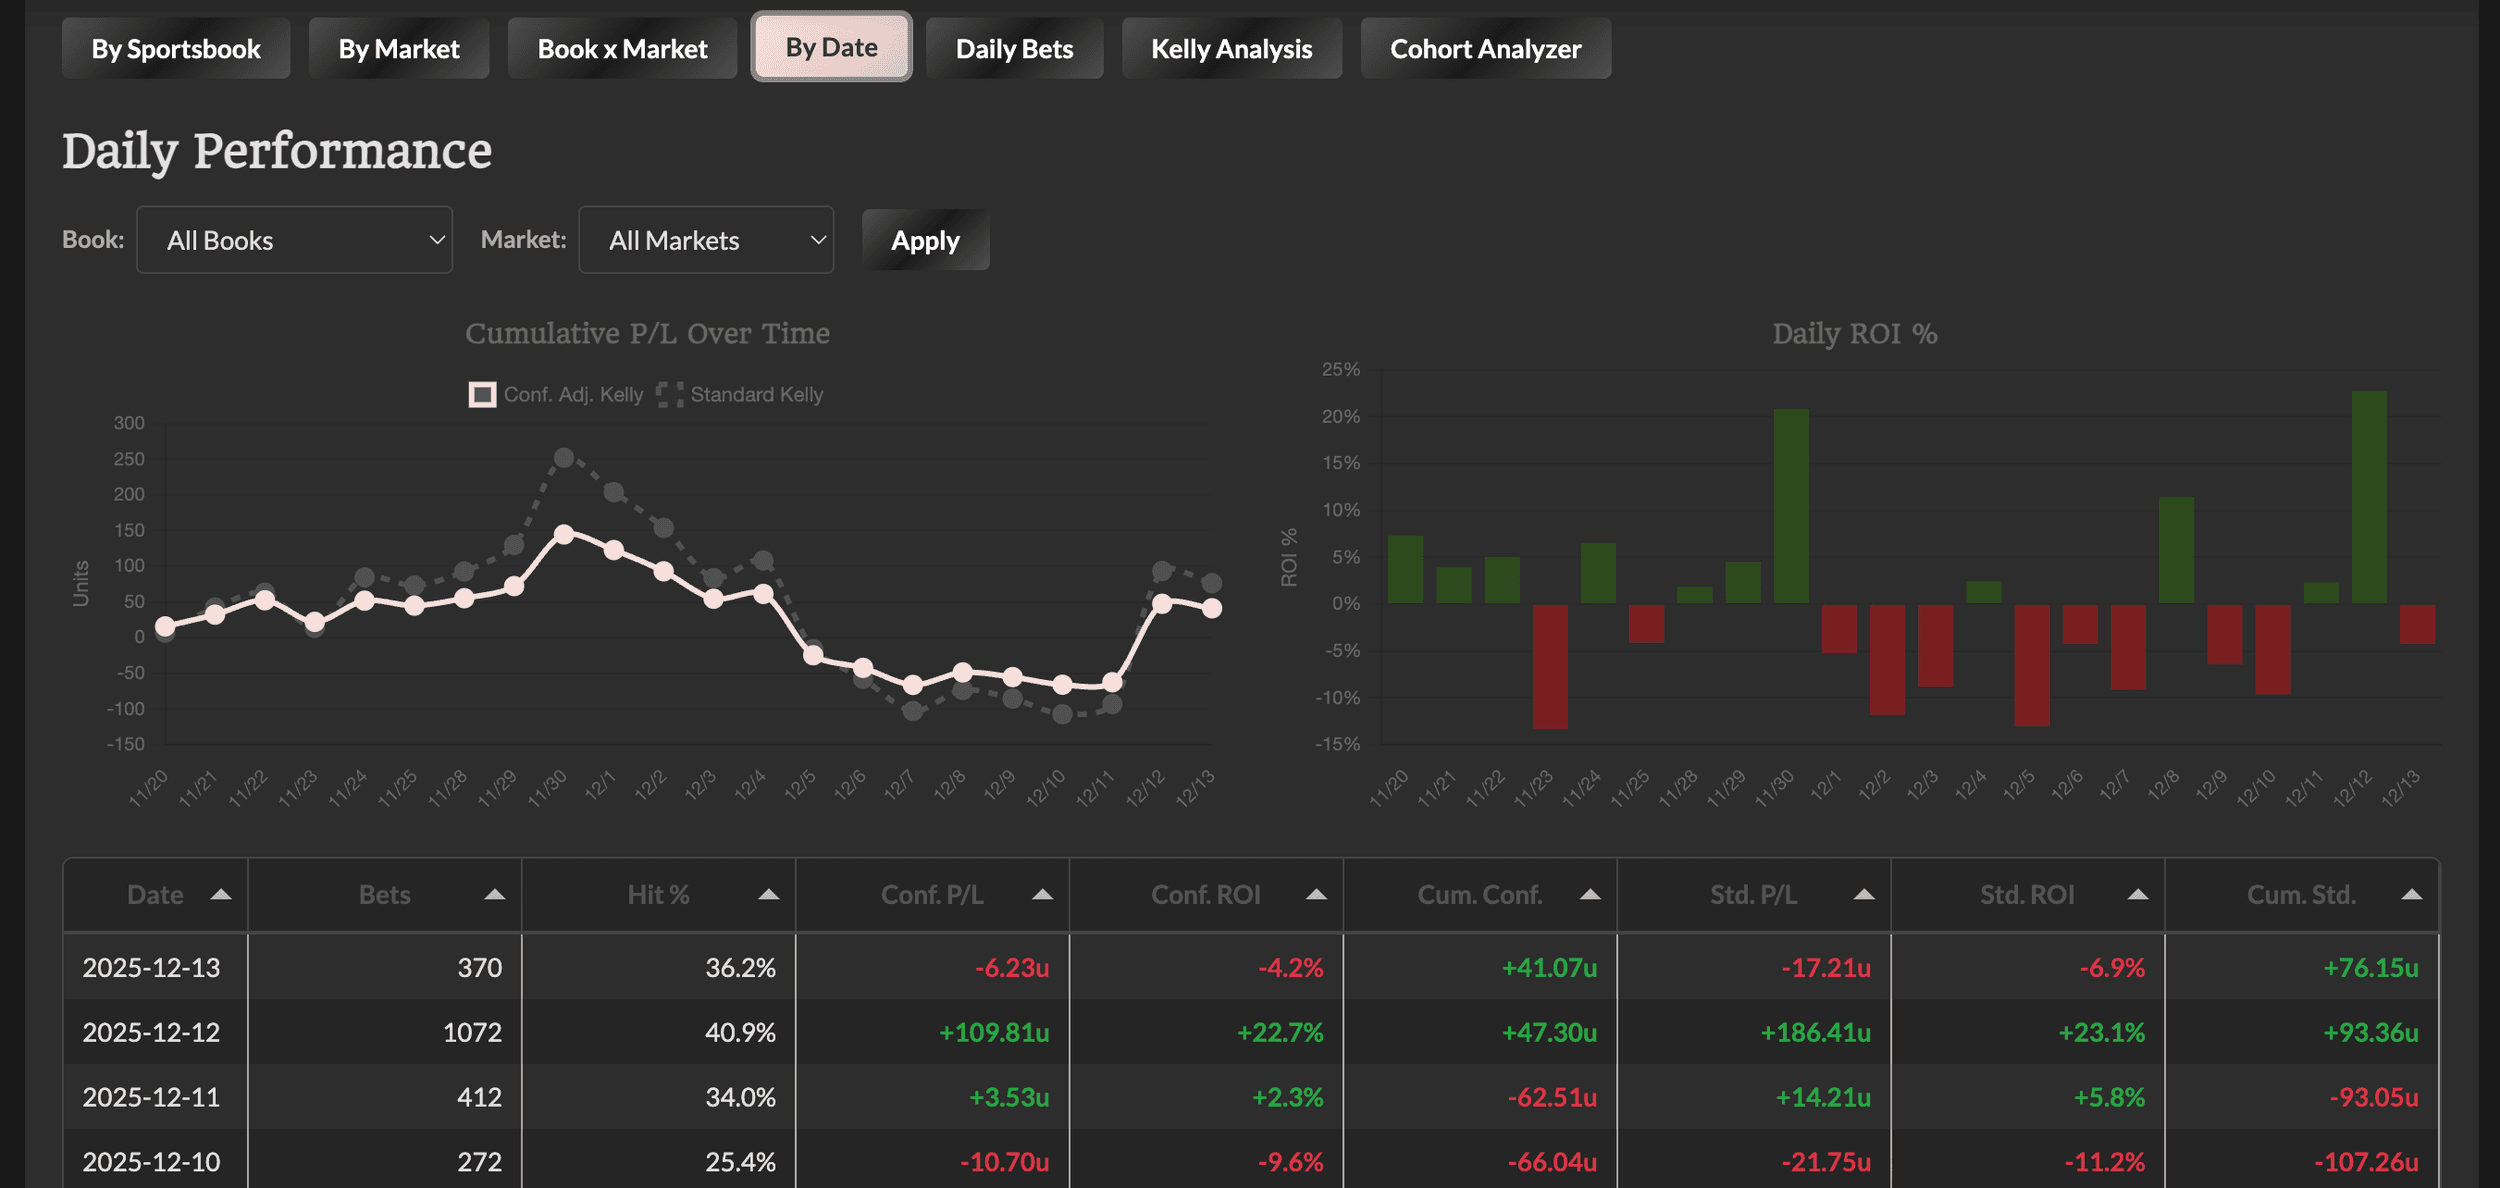
By Date Tab
Daily performance with two side-by-side charts and a detailed table with cumulative running totals.
The Charts:
-
Cumulative P/L Over Time (left) - Line chart showing the running total trajectory. The solid pink line is Confidence-Adjusted Kelly (primary metric), and the dotted gray line is Standard Kelly (for comparison).
-
Daily ROI % (right) - Bar chart showing each day's ROI. Green bars = positive days, red bars = negative days. Great for visualizing daily variance at a glance.
Both charts use shortened date labels (M/D format) for readability and can be filtered by Book and Market.
Key table columns:
-
Date - Game date
-
Bets - Number of bets that day
-
Hit % - Win percentage
-
Conf. P/L - That day's profit/loss (confidence-adjusted)
-
Conf. ROI - That day's return on investment
-
Cum. Conf. - Running total from day 1
-
Std. P/L / Std. ROI / Cum. Std. - Same metrics for Standard Kelly
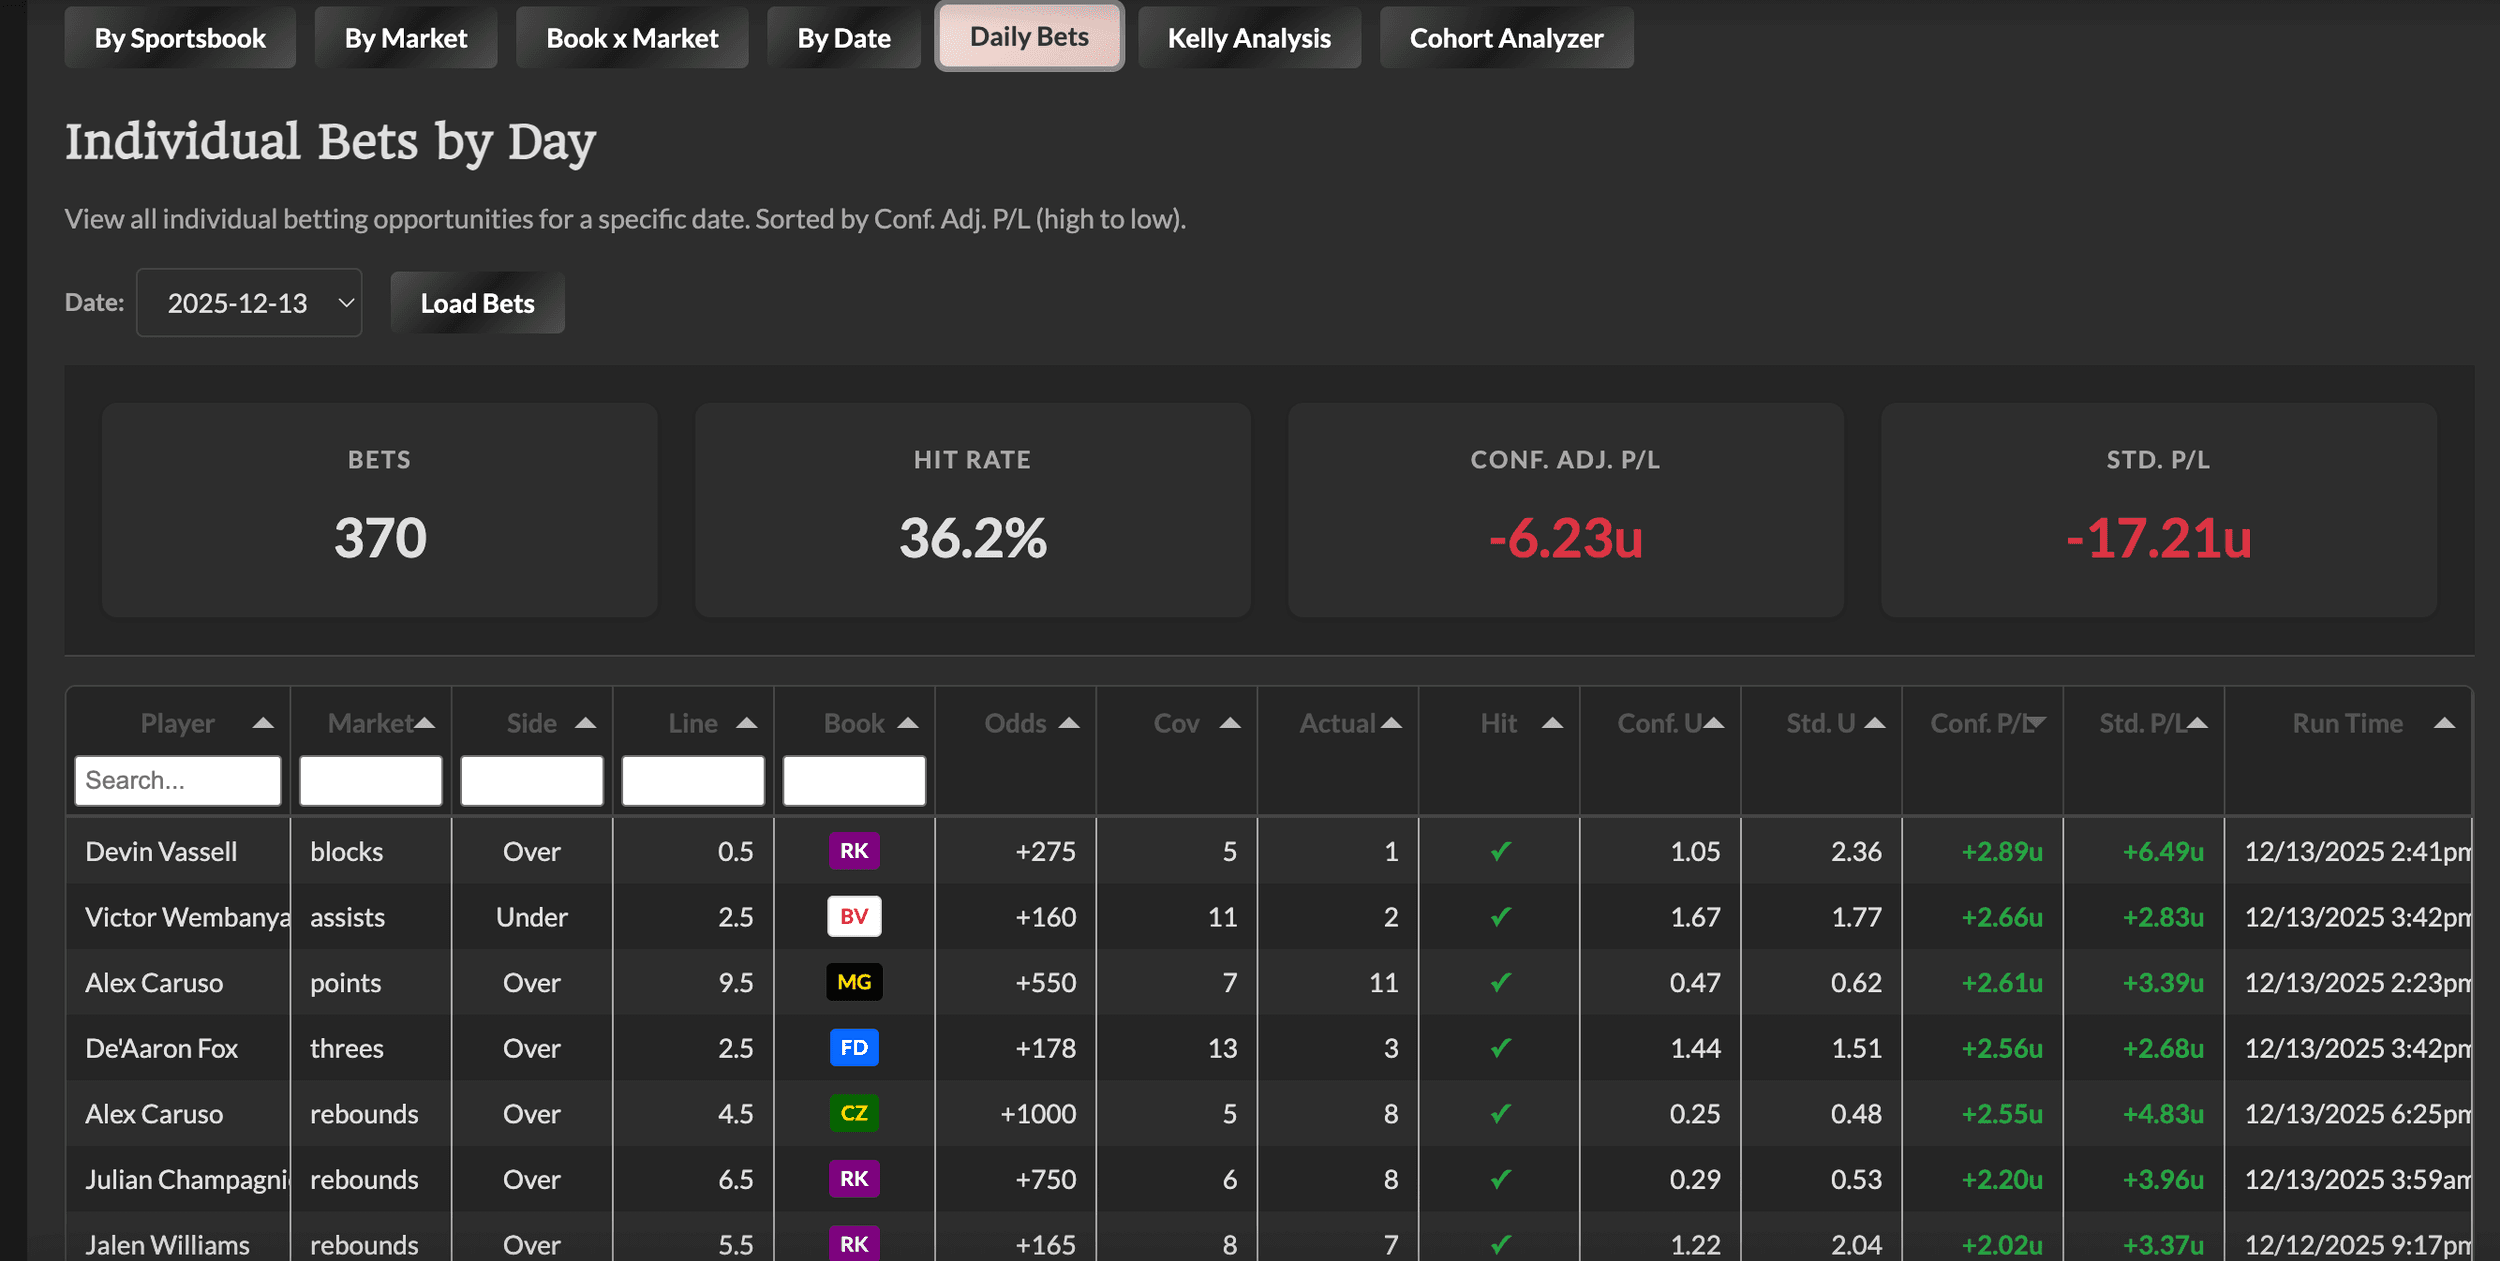
Daily Bets Tab
Drill into individual bets for any specific date. This is the most granular view - every single betting opportunity that appeared on the Value Finder that day.
How to use it:
-
Select a date from the dropdown
-
Click "Load Bets" to fetch the data
-
View summary cards for that day's totals
-
Browse individual bets sorted by Conf. Adj. P/L (highest to lowest)
-
Sort or filter on available columns to find specific bets results
What you can see for each bet:
-
Player name and market type
-
Line value and side (over/under)
-
Best book and odds
-
Coverage (number of books reporting)
-
MKB Group: Shows which cohort group(s) the bet qualifies for (💎 High Confidence, 💰 Value Long Shots, 🚨 Outlier Opportunities). Hover over the emoji(s) to see the full group name(s). A bet can qualify for multiple groups, or show "-" if it doesn't meet any group's criteria.
-
Actual stat value
-
Hit/miss status
-
Conf. Adj. Kelly stake and P/L
-
Std. Kelly stake and P/L
-
Run Time - The timestamp (in ET) of the selected occurrence, so you know which run was used for deduplication
Pro tip: Use the MKB Group column filter to quickly see only bets from a specific cohort - for example, filter to "💎" to see just the High Confidence plays from that day.
This is great for reviewing specific days - maybe you want to see what hit on a big winning day, or analyze what went wrong on a losing day.
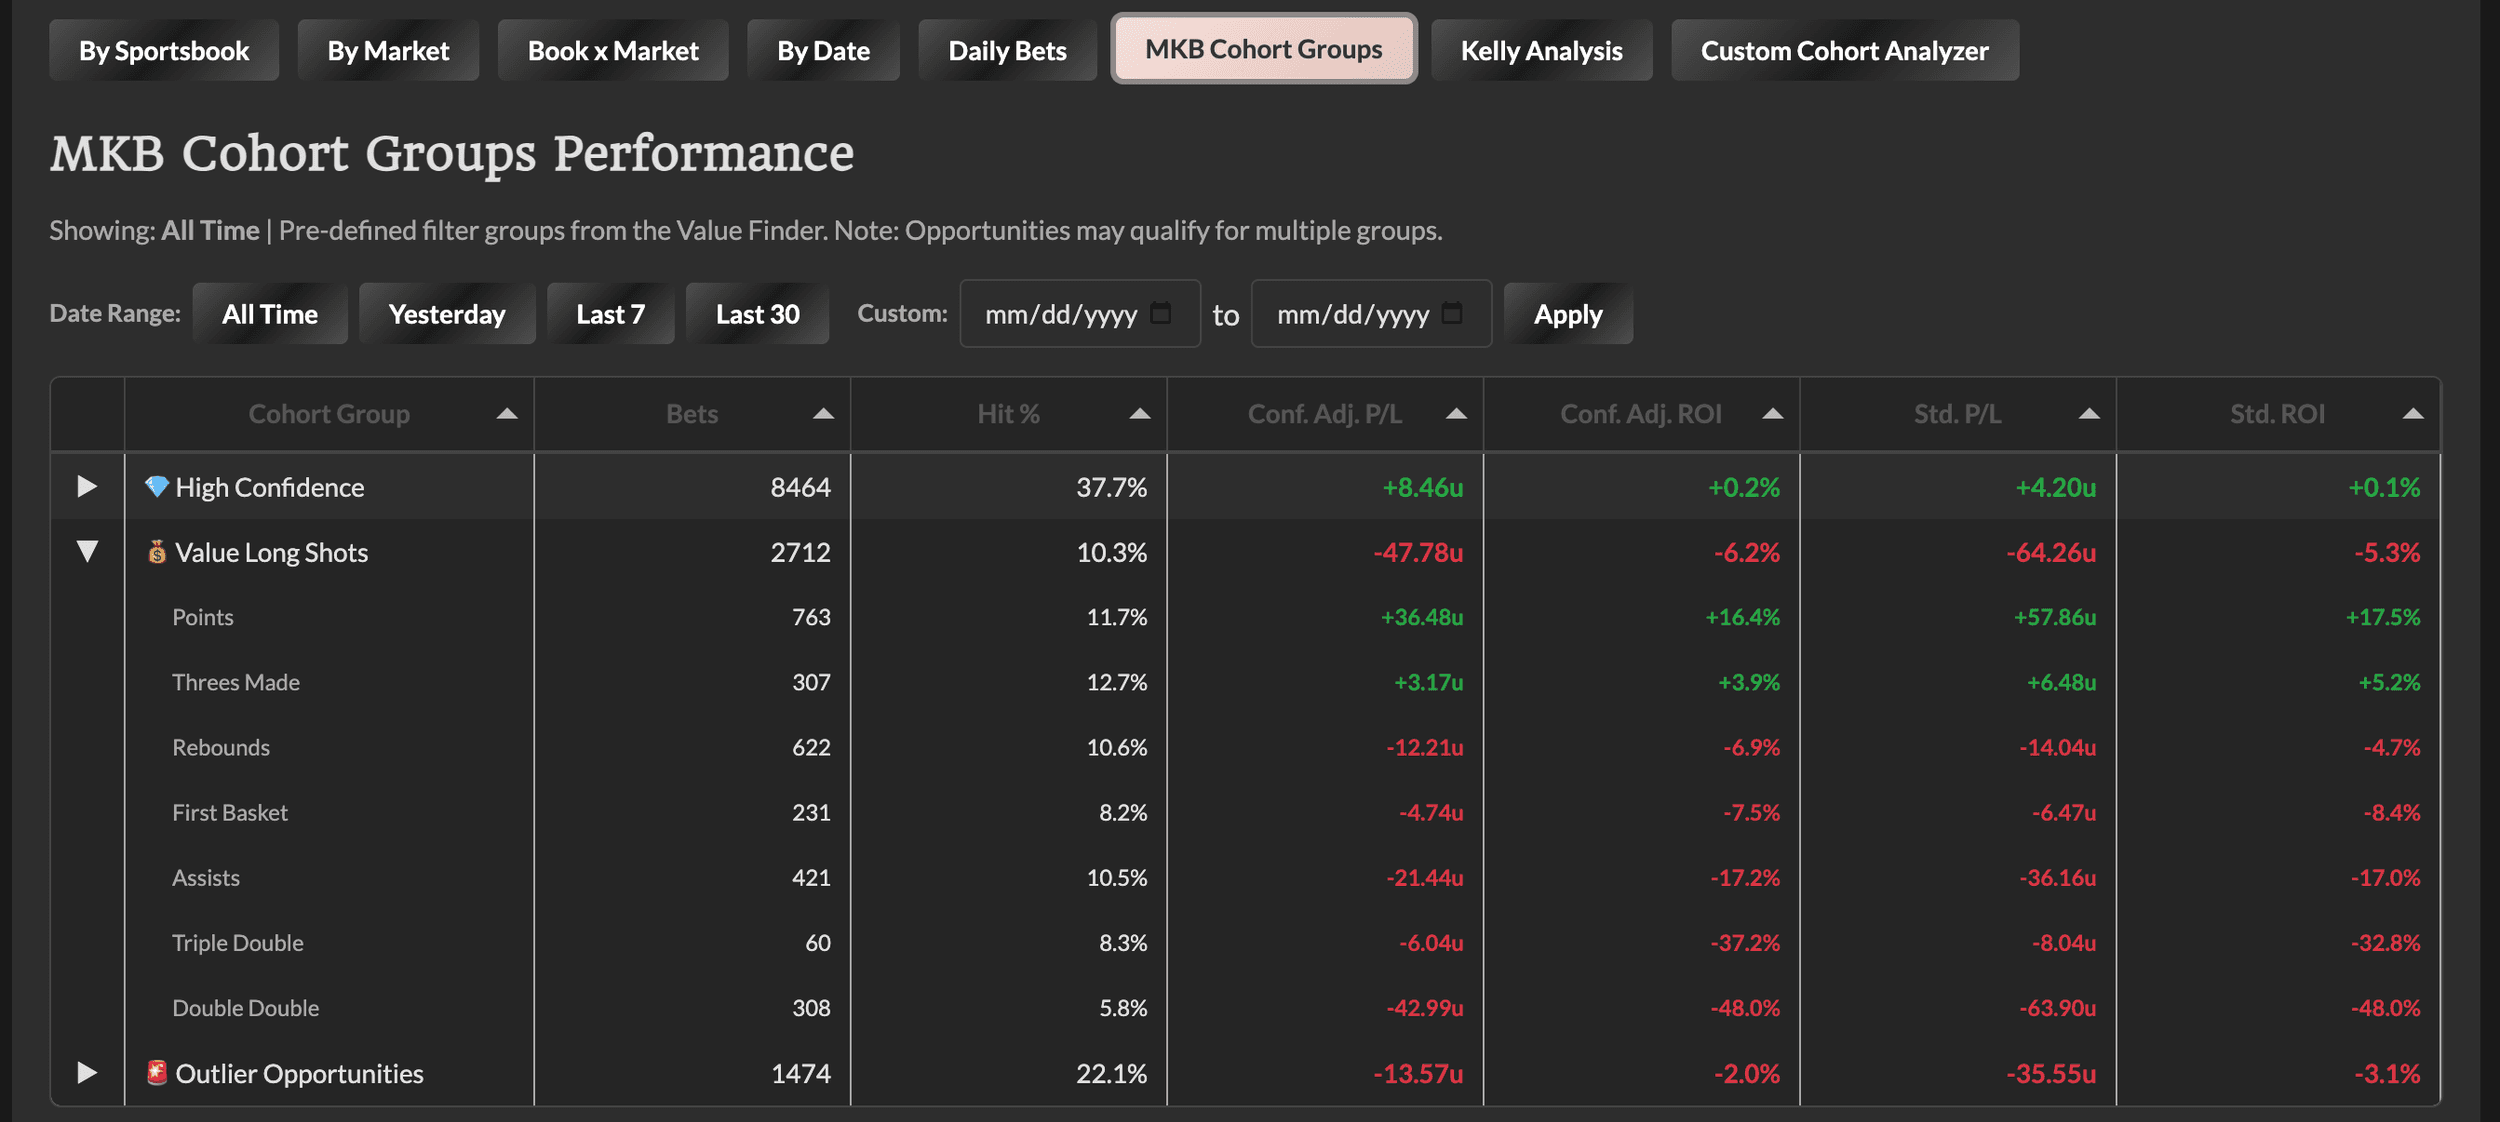
MKB Cohort Groups Tab
This tab shows performance for pre-defined filter groups that we've identified as potentially high-value opportunity subsets. These are the same cohort groups you see highlighted on the Value Finder itself.
The Three Cohort Groups:
-
💎 High Confidence: Conf. Adj. Kelly ≥ 0.15u AND Coverage ≥ 8 books
-
💰 Value Long Shots: Best Odds ≥ +500 AND Conf. Adj. Kelly ≥ 0.15u AND Coverage ≥ 6 books
-
🚨 Outlier Opportunities: % vs Next Book ≥ 35% AND Coverage ≥ 4 books AND Conf. Adj. Kelly ≥ 0.05u
Key columns:
-
Cohort Group - The group name with its emoji identifier
-
Bets - Number of bets qualifying for this group
-
Hit % - Win percentage
-
Conf. Adj. P/L / ROI - Profit/loss and return using confidence-adjusted stakes
-
Std. P/L / ROI - Same metrics using standard Kelly
Important note: A single bet can qualify for multiple groups. For example, a high-coverage long shot with strong Kelly could appear in both High Confidence and Value Long Shots. This means the totals across groups won't add up to the total bets in the dashboard - that's expected.
Pro tip: Click any row to expand and see that cohort's market breakdown. This shows you which prop types are driving performance within each cohort group.
Date range filters work the same as other tabs - use the buttons (All Time, Yesterday, Last 7, Last 30) or set a custom range to see how cohorts perform across different time windows.
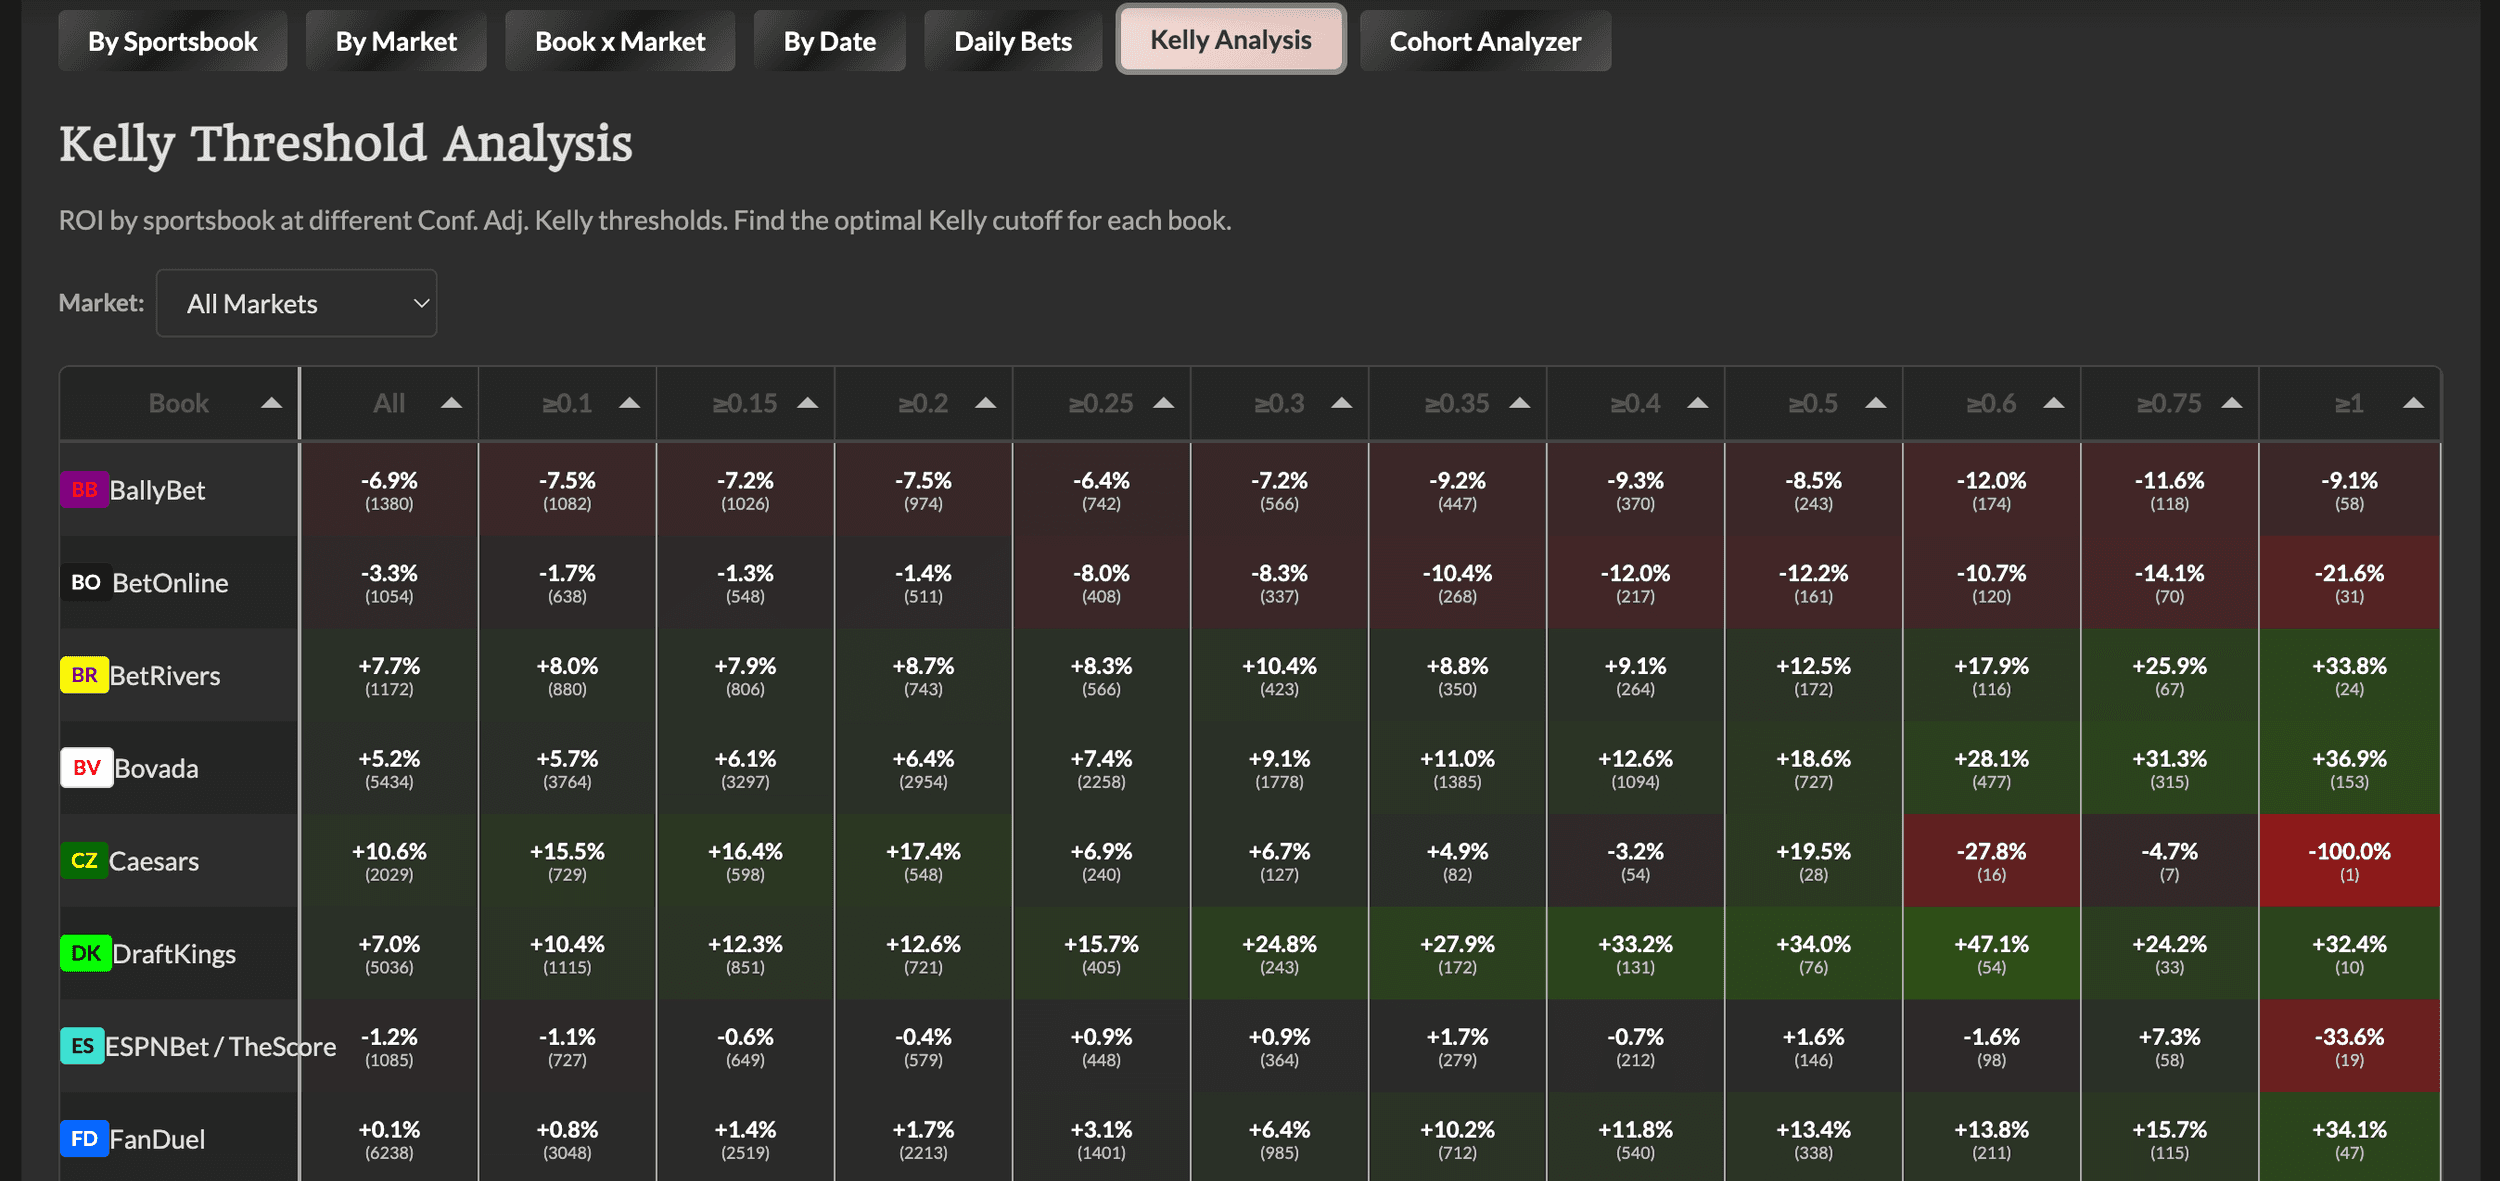
Kelly Analysis Tab
A powerful view showing ROI by sportsbook at different Kelly thresholds. This helps you find the optimal minimum Kelly cutoff for each book.
How to read the table:
-
Rows = Sportsbooks
-
Columns = Kelly thresholds (≥0.1, ≥0.25, ≥0.5, ≥1.0, etc.)
-
Each cell shows: ROI% (number of bets)
What this tells you: Some books might perform well at low Kelly thresholds but poorly at high ones (or vice versa). This table helps you identify patterns like:
-
"DraftKings is profitable at ≥0.5u but not at lower thresholds"
-
"Hard Rock shows positive ROI across all thresholds"
-
"FanDuel only becomes profitable at ≥1.0u"
Pro tip: You can filter by market type to see if these patterns hold across different prop types.
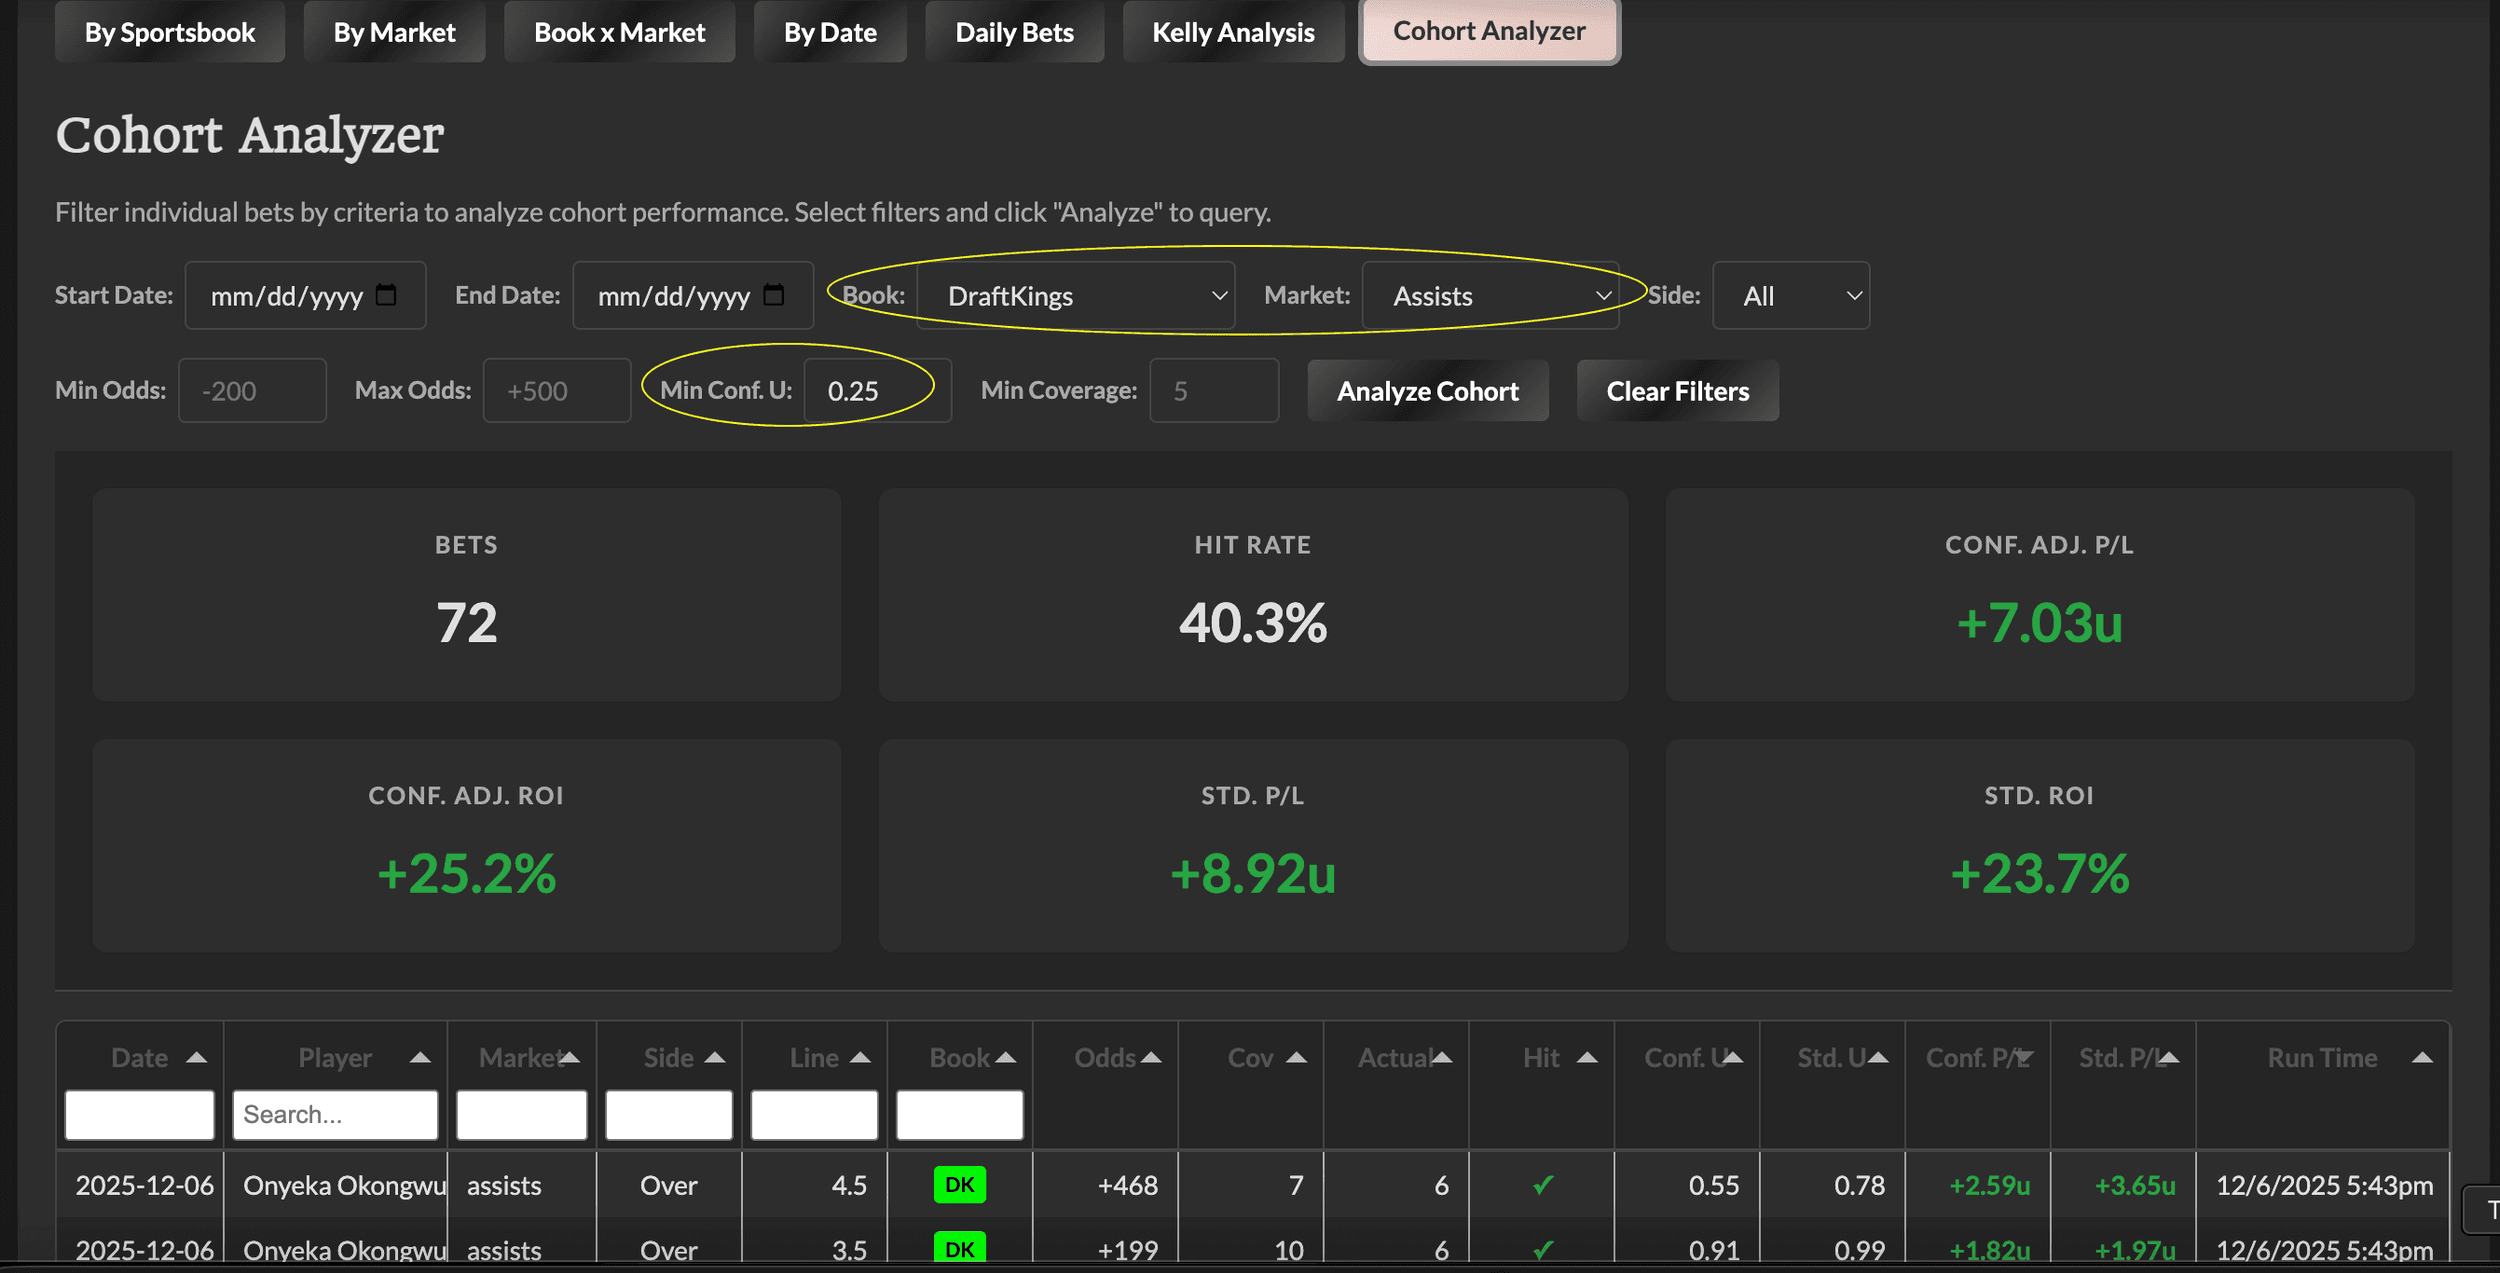
Custom Cohort Analyzer Tab
The most flexible analysis tool - build custom queries to analyze specific subsets of bets.
Available filters:
-
Date range (start and end)
-
Sportsbook
-
Market type
-
Side (over/under)
-
MKB Group - Filter to a specific cohort group (💎 High Confidence, 💰 Value Long Shots, or 🚨 Outlier Opportunities)
-
Min/max odds range
-
Min Conf. Kelly threshold
-
Min coverage (number of books)
Use cases:
-
"How did FanDuel Points overs perform in the last 30 days?"
-
"What's the ROI on high-Kelly (≥1.0u) rebounds bets?"
-
"How are unders performing vs overs across all markets?"
-
"What's the hit rate on plus-money bets (+100 or better)?"
-
"How are High Confidence (💎) plays performing at DraftKings?"
-
"What's the ROI on Value Long Shots (💰) in the last week?"
Click "Analyze Cohort" to run your query, or "Clear Filters" to reset.
The results table includes all the same columns as Daily Bets (including MKB Group and Run Time) and can be filtered, sorted, and exported. The MKB Group column shows which cohort(s) each bet qualifies for - hover over the emoji(s) to see the full group name(s).
Understanding the Filters
The dashboard has two types of filters: one global filter that affects every tab, and tab-specific filters that only apply to the tab you're viewing.
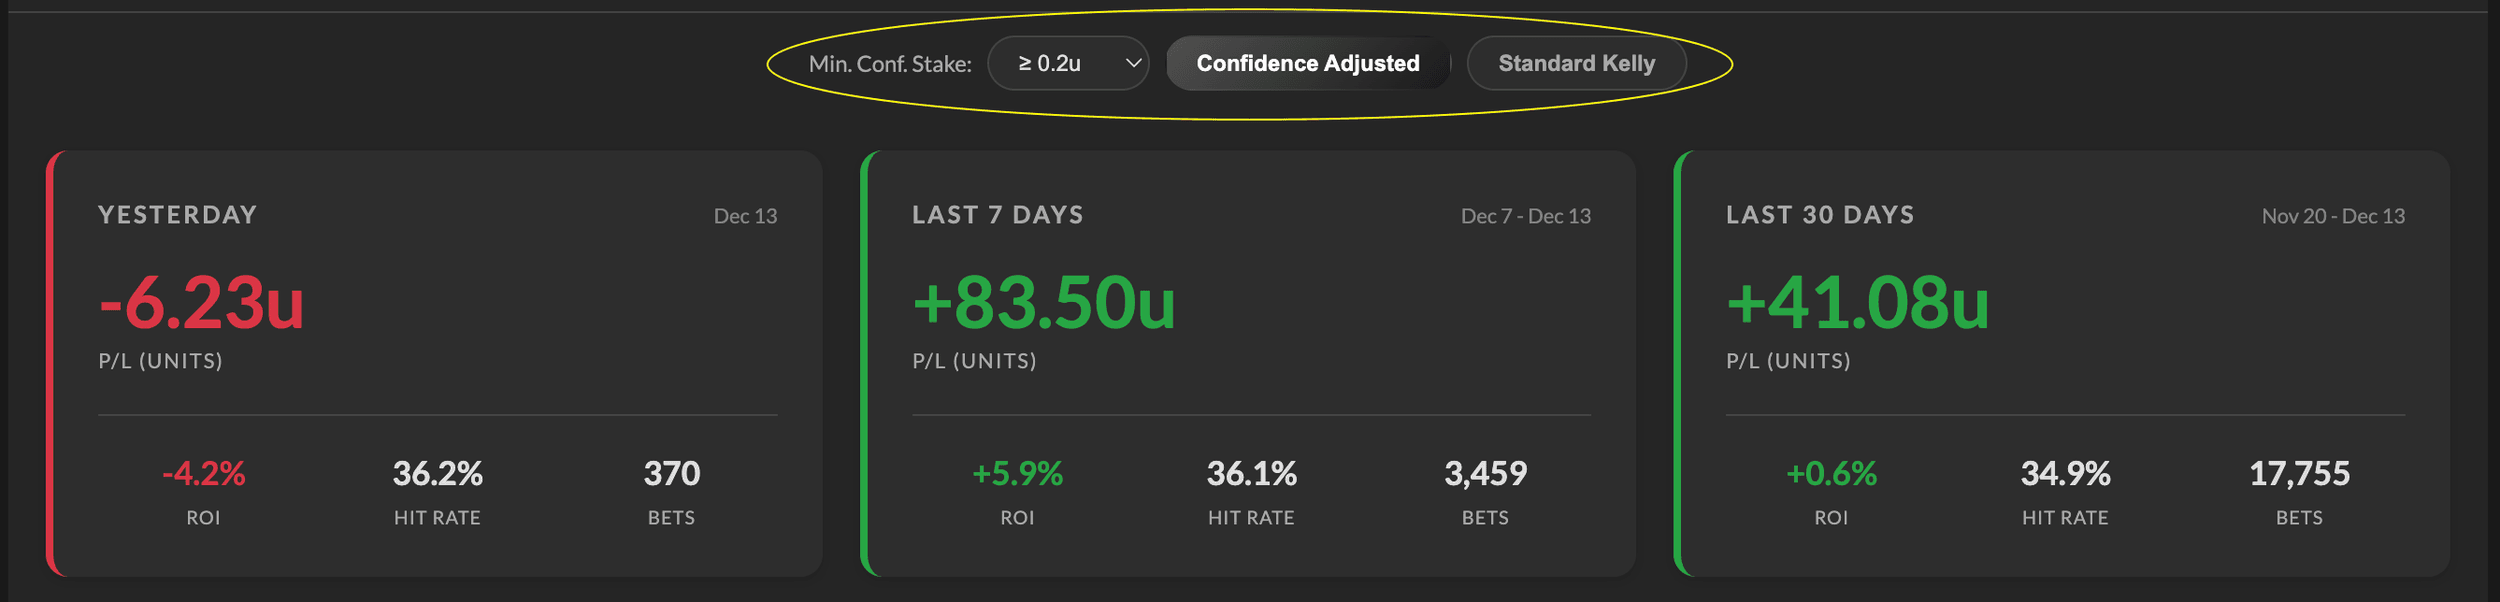
The Global Filter: Min. Conf. Stake
At the top of the dashboard (next to the title), you'll see a dropdown labeled Min. Conf. Stake. This is the most important filter to understand.
What it does: Filters ALL data across the ENTIRE dashboard to only show bets at or above the selected stake size.
Options:
-
All Bets
-
≥ 0.1u
-
≥ 0.2u (default)
-
≥ 0.3u
-
≥ 0.4u
-
≥ 0.5u
-
≥ 0.6u
-
≥ 0.75u
-
≥ 1u
Why use it: If you only take bets above a certain threshold, set this filter to see how that strategy would have performed. The default (≥ 0.2u) aligns with our recommended minimum stake threshold. This filter affects:
-
The summary cards at the top
-
Every tab's tables and charts
-
All calculations (P/L, ROI, hit rate)
Pro tip: The results dashboard Discord notifications use a ≥0.20u filter - so keep the default (≥ 0.2u) to see the same data reflected in Discord updates.
Tab-Specific Filters
Each tab has its own filters designed for that specific analysis. Here's what's available on each:
By Sportsbook Tab Filters
Date Range Buttons:
-
All Time - Full tracking period
-
Yesterday - Most recent game day
-
Last 7 - Rolling 7 game-days
-
Last 30 - Rolling 30 game-days
Custom Date Range: Start and end date pickers for any specific period
Why use them: See which books are hot right now vs. long-term performance. If a book is crushing it lately but not all-time (or vice versa), that's valuable intel.
By Market Tab Filters
Same as By Sportsbook:
-
Date Range Buttons (All Time, Yesterday, Last 7, Last 30)
-
Custom Date Range
Why use them: Identify which prop types are performing best in different time windows. Maybe rebounds have been hitting lately even if points has the better all-time record.
Book x Market Tab Filters
This tab has the most filters because it's the most granular view:
Date Range: Same buttons + custom range as above
Book Dropdown: Filter to show only specific sportsbooks
Market Dropdown: Filter to show only specific prop types
Min Bets: Set a minimum sample size (default: 10). Smaller sample sizes can show misleading results.
Why use them: When you want to answer specific questions like "How is FanDuel Points doing in the last 30 days?" or "Which book has the best Assists performance with at least 25 bets?"
By Date Tab Filters
Book Dropdown: Filter cumulative chart and daily table to a specific sportsbook
Market Dropdown: Filter to a specific prop type
Why use them: Track the trajectory of a specific book or market over time. Great for seeing if a book/market combo is trending up or down.
Daily Bets Tab Filters
Date Dropdown: Select a specific date to load all individual bets from that day
Why use it: Review exactly what happened on a specific date - see every bet that appeared on the Value Finder that day, whether it hit or missed, and the exact P/L.
Kelly Analysis Tab Filters
Market Dropdown: Filter the Kelly threshold analysis to a specific prop type
Why use it: See if Kelly threshold patterns differ by market. Maybe rebounds require a higher minimum Kelly than points to be profitable.
Custom Cohort Analyzer Tab Filters
This is the power-user tab with the most filter options:
Date Range: Start Date and End Date pickers
Book: Specific sportsbook or All Books
Market: Specific prop type or All Markets
Side: Over, Under, or All
MKB Group: Filter to a specific pre-defined cohort group:
-
💎 High Confidence
-
💰 Value Long Shots
-
🚨 Outlier Opportunities
-
Or "All Groups" to include everything
Min Odds / Max Odds: Filter by American odds range (e.g., only look at plus-money bets by setting Min Odds to 100)
Min Conf. U: Minimum Confidence-Adjusted stake (similar to global filter, but for this specific query)
Min Coverage: Minimum number of books reporting the line (filter for high-confidence bets)
Why use them: Answer any specific question you can think of. Examples:
-
"How do FanDuel overs perform at +150 or better?"
-
"What's the hit rate on high-coverage (8+ books) bets?"
-
"How are assists unders doing when Kelly is above 0.5u?"
-
"How are High Confidence plays performing overall?"
-
"What's the ROI on Value Long Shots at DraftKings?"
The results table shows individual bets matching your filters, including the MKB Group column (showing which cohort(s) each bet qualifies for) and Run Time column so you can see exactly which occurrence was selected for each bet.
Interpreting the Results
What's a Good Hit Rate?
It depends on the odds. A 40% hit rate on +150 average odds is profitable. A 60% hit rate on -200 average odds might not be.
That's why ROI % is more meaningful than hit rate. ROI accounts for both win rate AND the odds.
What's a Good ROI?
In sports betting, even 2-5% ROI is considered good long-term. 10%+ is excellent.
Remember: these are results from an automated tool scanning thousands of opportunities. We're not cherry-picking winners.
Sample Size Matters
A book/market combo with 5 bets at +40% ROI is interesting but not conclusive. The same combo with 200+ bets at +15% ROI is much more meaningful.
Use the min bets filter on Book x Market to focus on combinations with enough volume to trust.
Variance is Real
You'll see losing days. You'll see losing weeks. That's normal. The math plays out over hundreds and thousands of bets, not dozens.
The By Date tab with cumulative totals helps you see the long-term trajectory through the noise.
How We Use This Data to Improve the Tool
The Results Dashboard isn't just for transparency - we actively use it to refine book weights and improve Fair Value calculations. Here's the methodology:
The Core Hypothesis
Positive ROI at a book/market combo = that book is "soft" (exploitable) If we're consistently profiting when a book has the best odds, it means they're pricing lines less accurately than the market consensus. Their lines are beatable.
Negative ROI at a book/market combo = that book is "sharp" (accurate) If we're consistently losing when a book has the best odds, it means their lines are actually more accurate than we're giving them credit for. They're not soft - they're sharp.
How This Translates to Weight Updates
When we see these patterns with sufficient sample size:
Sharp books get MORE weight in Fair Value calculations If a book has negative ROI in a market, we increase their weight. Why? Because their lines are proving to be more accurate predictors of outcomes. We want sharper books influencing Fair Value more heavily.
Soft books get LESS weight (or stay the same) If a book has positive ROI, we might decrease their weight or keep it neutral. We don't want easily-exploitable lines pulling Fair Value in the wrong direction.
Why Market-Specific Weights Matter
A book might be sharp in one market and soft in another. For example:
-
Book A could be excellent at pricing Points props but poor at Rebounds
-
Book B might nail Threes but struggle with combo markets like PRA
That's why we moved from universal book weights to market-specific weights. The same book can have different weights depending on which prop type you're looking at.
When We Make Updates
We don't change weights reactively based on short-term results. Weight updates require:
-
Sufficient sample size - typically 100+ bets minimum for a book/market combo
-
Consistent pattern - not just a hot or cold streak, but sustained over/underperformance
-
Statistical significance - the pattern needs to be meaningful, not noise
This applies across all sports using the Value Finder methodology (NBA, NFL, etc.). Each sport's Results Dashboard feeds into weight refinements for that sport.
Methodology Reference
For the technically curious, here's exactly how results are calculated:
Tiered Selection
Each unique opportunity (player/market/side/line/game) counted once using tiered selection:
-
Tier 1: First occurrence with Kelly ≥ 0.20u AND 5+ book coverage
-
Tier 2: First occurrence with 5+ book coverage (if no Tier 1)
-
Tier 3: Median occurrence by timestamp (if no Tier 2)
Best Book Ties
When multiple books tie for best odds, a priority order determines which book gets credit: PN > FD > DK > MG > ES > FN > CZ > BB > RK > BR > BV > FL > RB > BO
Confidence-Adjusted Stake
Uses the Confidence-Adjusted Kelly recommendation from the selected occurrence as the stake size.
Standard Stake
Uses the Standard Kelly recommendation (without confidence adjustment) for comparison.
DNP Handling
Did Not Play records are excluded from all P/L calculations. If a player doesn't play, the bet is a push/void.
Excluded Markets
First Team Basket, First Basket Method, and Q1 props are excluded because we lack game log data to verify results for these markets.
First Basket Settlement
Settlement for First Basket props varies by book:
-
First Field Goal books (BetMGM, Fanatics, BallyBet, BetRivers): Settle on who scores the first field goal - free throws don't count
-
First Point books (all others including DraftKings, FanDuel, Caesars, etc.): Settle on who scores the first point - free throws do count
Each bet is settled according to its book's house rules. This matters because the same player could win at some books and lose at others on the same game.
Methodology Version History (Calculation Updates)
We continuously refine our methodology based on real performance data. The Calculation Updates section on the dashboard tracks significant updates so you can understand inflection points in the results.
Why This Matters
When we update how Fair Value is calculated - whether it's adjusting book weights, refining vig calculations, or changing confidence adjustments - those changes affect all opportunities found from that date forward.
This creates natural "before/after" periods in the data:
-
Before the change: Results reflect the old methodology
-
After the change: Results reflect the new methodology
How to use this information:
-
When analyzing long-term performance, be aware that methodology changes may cause inflection points
-
Use the date filters to isolate performance before/after specific changes
-
If you see a sudden shift in results (positive or negative), check if it aligns with a methodology update
-
Don't mix pre- and post-change periods when evaluating whether a specific approach is "working"
Quick Reference
What to Check Daily
-
Yesterday's summary card for quick P/L
-
Daily Bets tab to see individual results
-
By Date tab to see the cumulative trend
What to Check Weekly
-
By Sportsbook to see which books are performing
-
By Market to see which prop types are hitting
-
Kelly Analysis to identify optimal thresholds
What to Check Monthly
-
Book x Market for granular patterns
-
Compare Conf. Adj. vs Standard to validate methodology
-
Cohort Analyzer for deep dives into specific questions
Red Flags to Watch
-
Consistent underperformance at a specific book
-
A market type that's bleeding losses
-
Big divergence between Conf. Adj. and Standard (might indicate confidence weights need adjustment)
-
Kelly Analysis showing a book is only profitable at very high thresholds
Questions?
The Results Dashboard updates daily as games complete. Check back regularly to see how things are tracking.
If you have questions about the methodology or want to discuss patterns you're seeing, drop them in Discord!
Ready to put this to use? Head to the NBA Value Finder Results Dashboard and explore the data! [NHL & NFL Coming Soon!]
To learn more about the Value Finders themselves, head to How To Use the Value Finders: A Complete Guide.
Finding value matters.
Unlock our full suite of tools and join a community of sharp bettors.
- All Value Finders
- Projection models & sims
- Full Discord access
- NBA, NFL, NHL, MLB & Golf
- Data export
Starting at $20/month — 14-day money-back guarantee
Join MKB VIP