

How To Use the Value Finders: A Complete Guide
Learn to read any Value Finder board: every column, how fair value is built, the toolbar, sparklines, line movement and liquidity, and how to act on a bet.
On this page
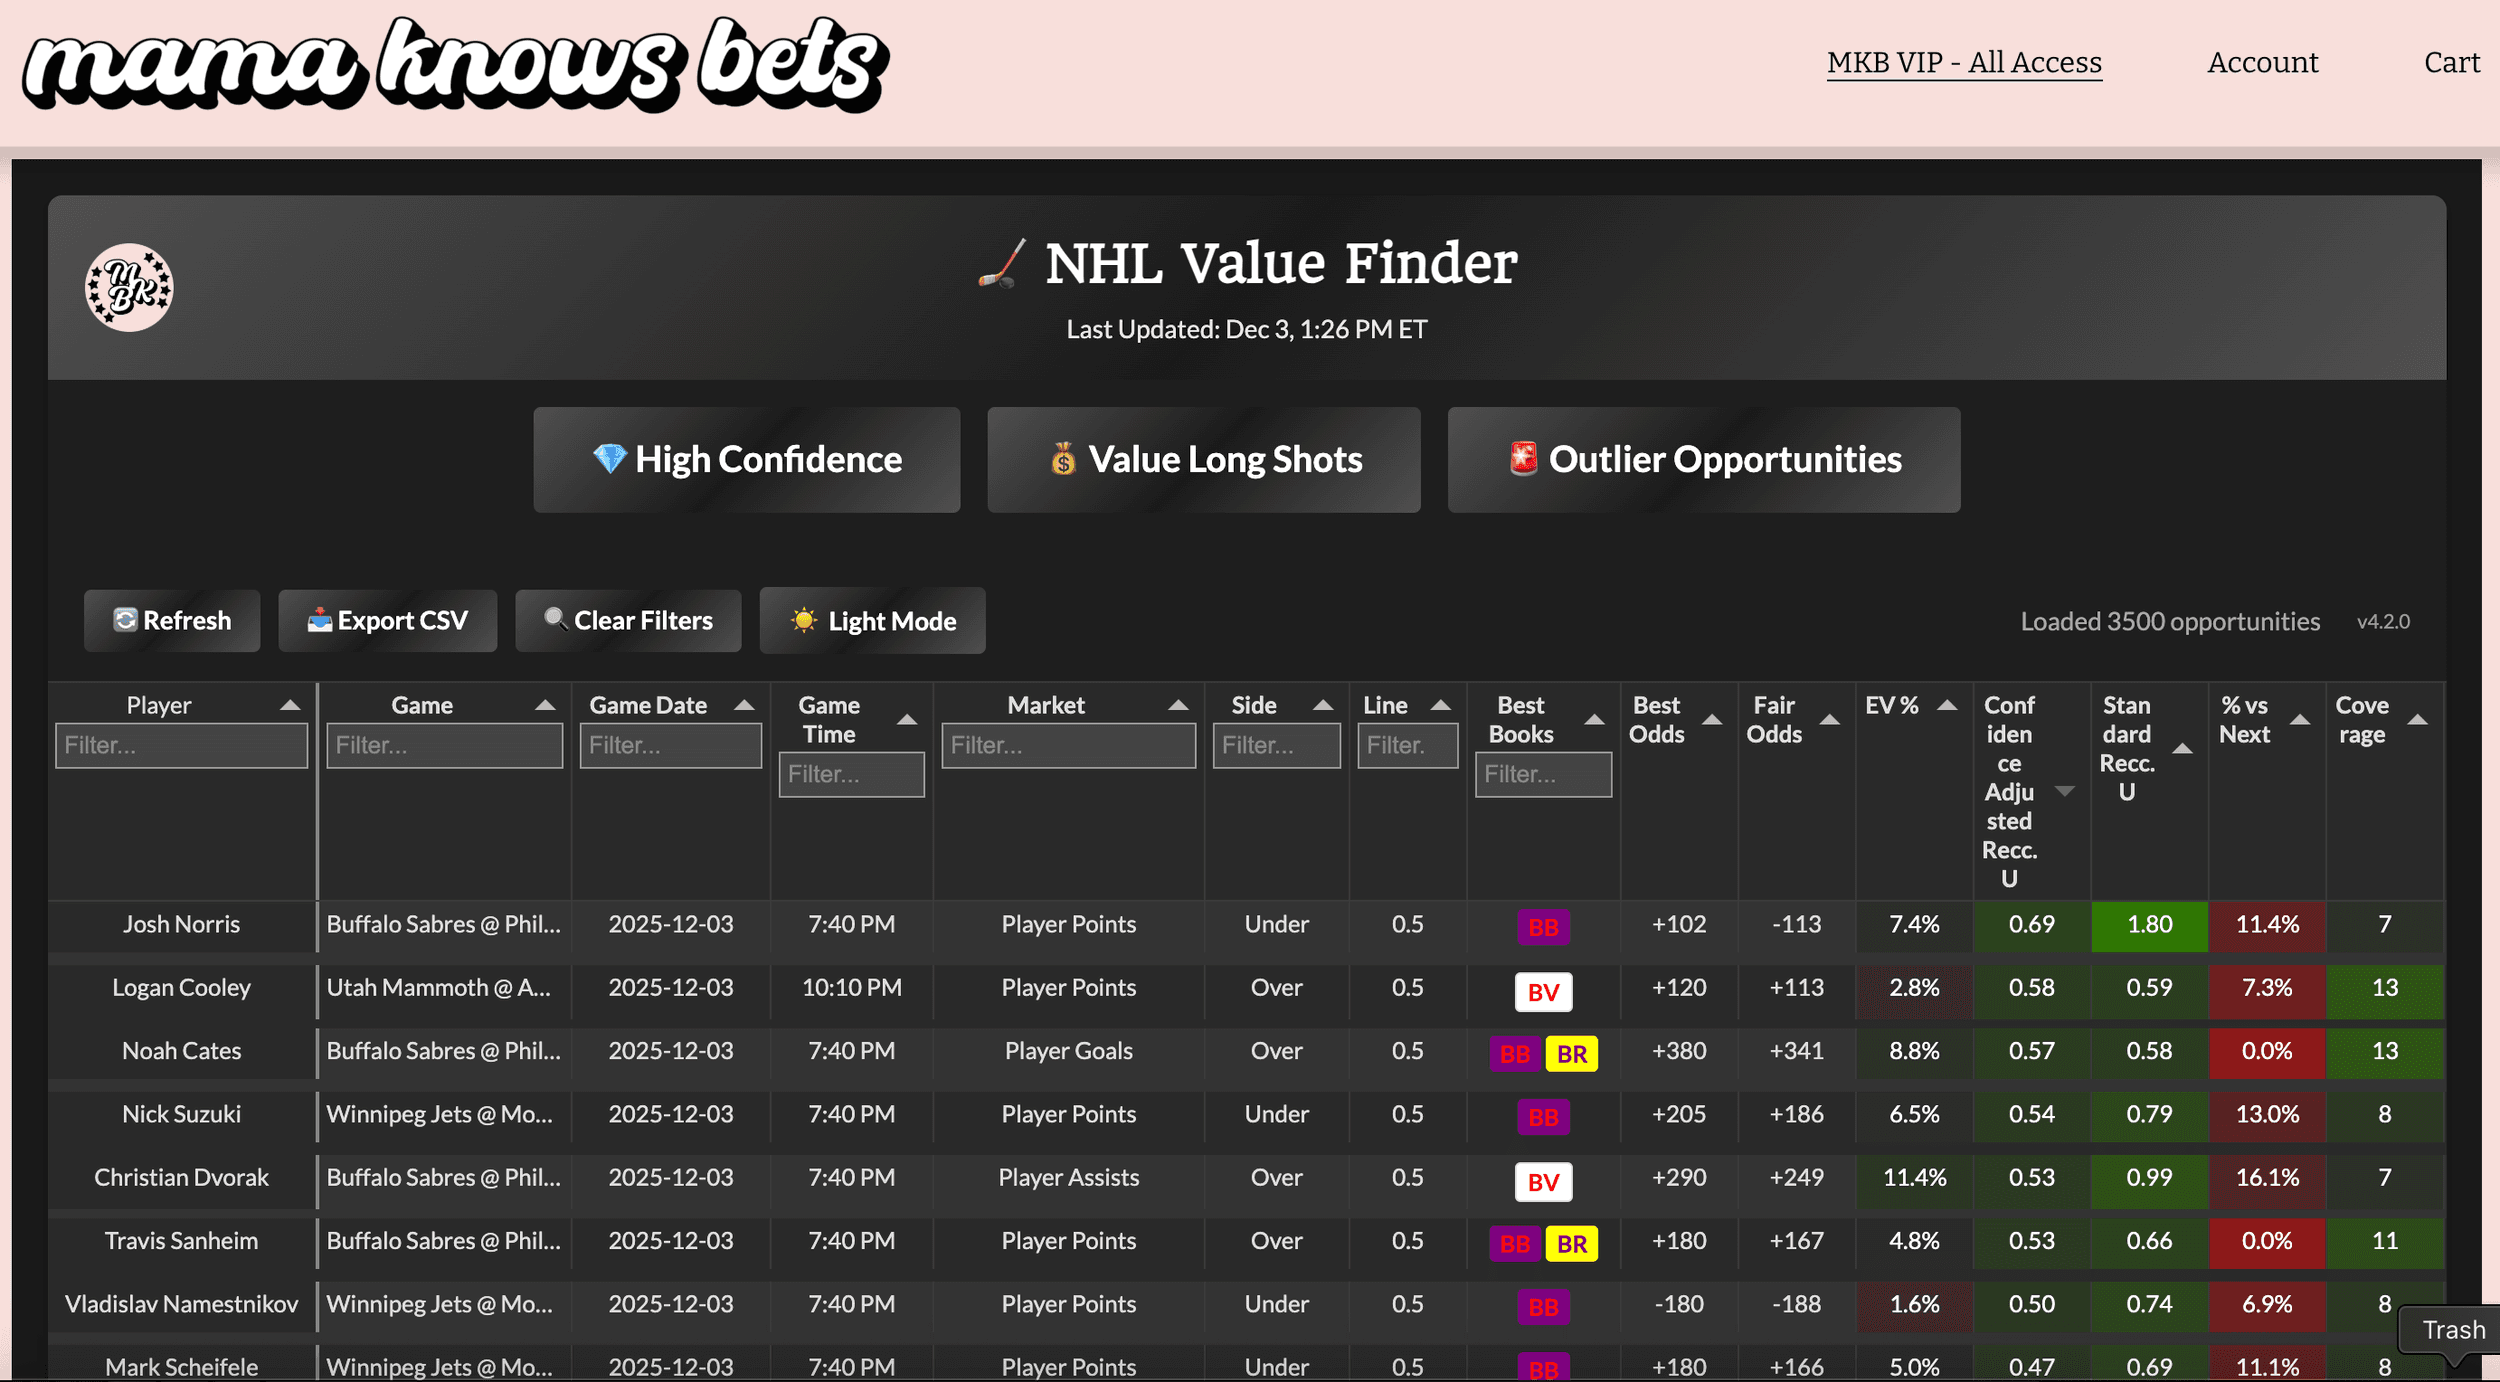
This is the how-to-read-the-board guide that applies to every sport's Value Finder: what each column means, how we calculate fair value, and how to turn what you see into a bet. Each sport's own guide covers the tabs and markets specific to that sport.
What is the Value Finder?#
The Value Finder is your tool for identifying +EV (positive expected value) betting opportunities. It scans odds across multiple sportsbooks, calculates fair value based on sharp book consensus, and surfaces bets where you're getting better odds than the true probability suggests.
In simple terms: it finds bets where the math is on your side.
The Basics#
-
Each sport has its own Value Finder, inside that sport's Tool Suite (MLB, NFL, NBA, NHL, WNBA, Golf, Soccer, NCAAF and NCAAB), plus the Futures Value Finder. Best of All puts every sport's board in one place.
-
The Value Finders update throughout the day, and less often overnight, whenever there are lines available for upcoming games
-
Easy links to the Value Finders live on the MKB VIP Homepage (bookmark this!), and there are also links to each Value Finder included with each update pinged in the Discord #value-finders channel
Understanding the Columns#
Let's break down each column so you know exactly what you're looking at.
Player, Game & Bet Info#
The Value Metrics (The Important Stuff)#
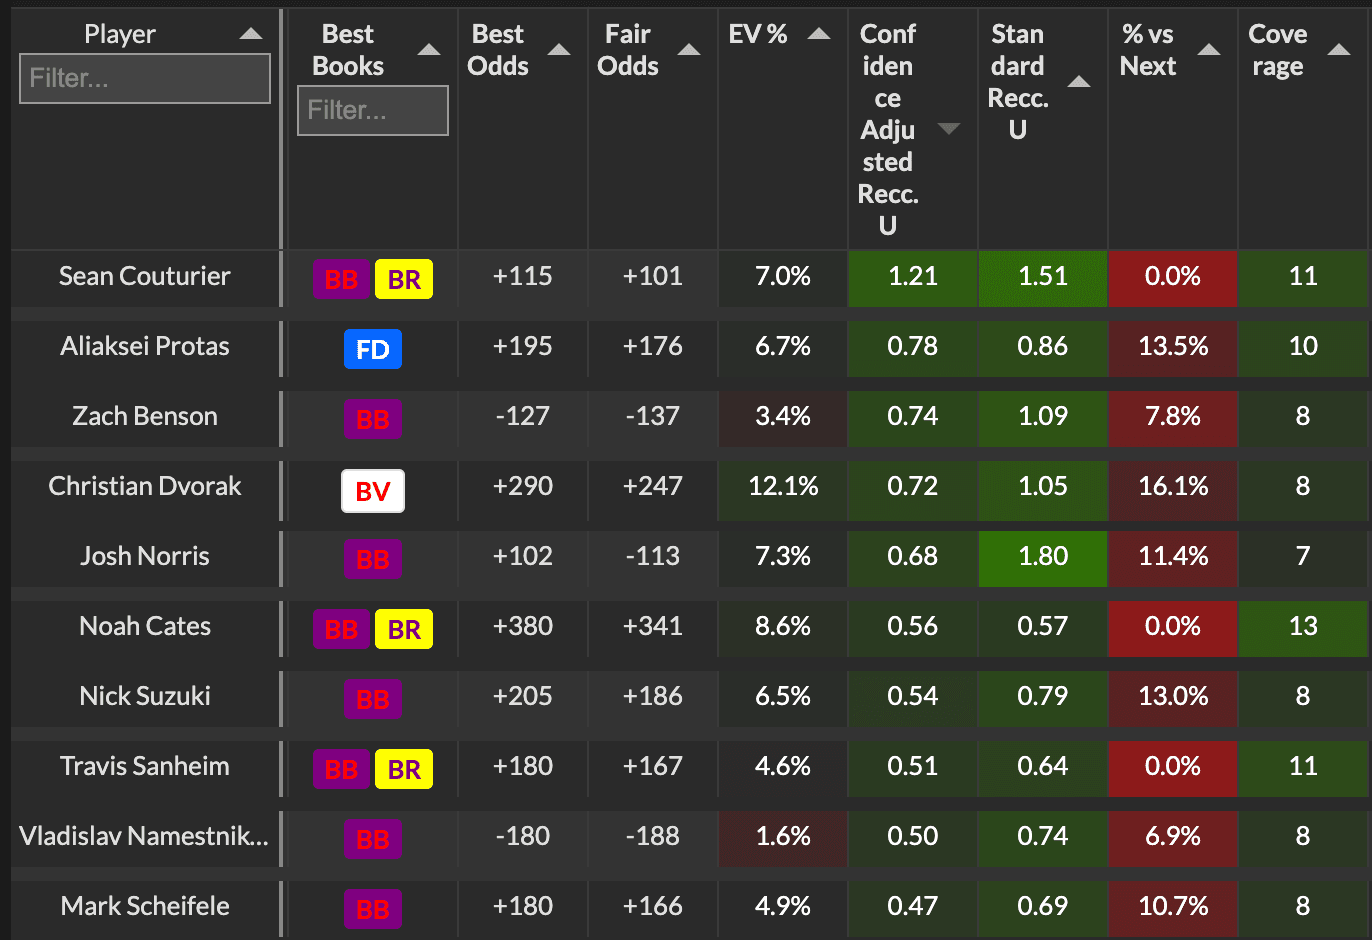
These are the columns that tell you HOW MUCH value exists in the bet.
-
Best Books - The sportsbook(s) offering the best odds for this bet
- This is where you should place your bet to maximize value - the Best Book has the highest odds available across all books we track. If multiple books are tied, they will all appear here.
-
Best Odds - The American odds at that book (e.g., +360)
-
Fair Odds - Our calculated "true" odds based on sharp book consensus. Read How the Value Finder Calculates Fair Value below to see how we came to this number!
-
EV% - Expected Value percentage - how much edge you have (deep dive below)
-
Edge (pts) - How many points of win chance you have over the price. If we make a bet 30% to win and the book's +300 implies 25%, that's a 5-point edge.
- EV % grows with the odds, so long shots always show the biggest EV %. Edge reads the same at any odds, so it's an easy way to compare a -110 bet with a +400 one. Sort by it from the column header.
-
Conf. Adj. Recc. U - Recommended bet size adjusted for market confidence (deep dive below)
-
Std. Recc. U - Recommended bet size using a straight Kelly calculation (deep dive below)
-
% vs Next - How much better the best book is vs the next best option (deep dive below)
-
Coverage - How many books are offering odds on this market
-
Higher coverage = more confidence in the Fair Value calculation. I personally prefer lines with most/all books reporting odds
-
If coverage is low (only a few books), be more skeptical of the opportunity - the Fair Value may be less reliable
-
Impacts Conf. Adj. Recc. U - learn more in the deep dive below!
-
Individual Book Odds#
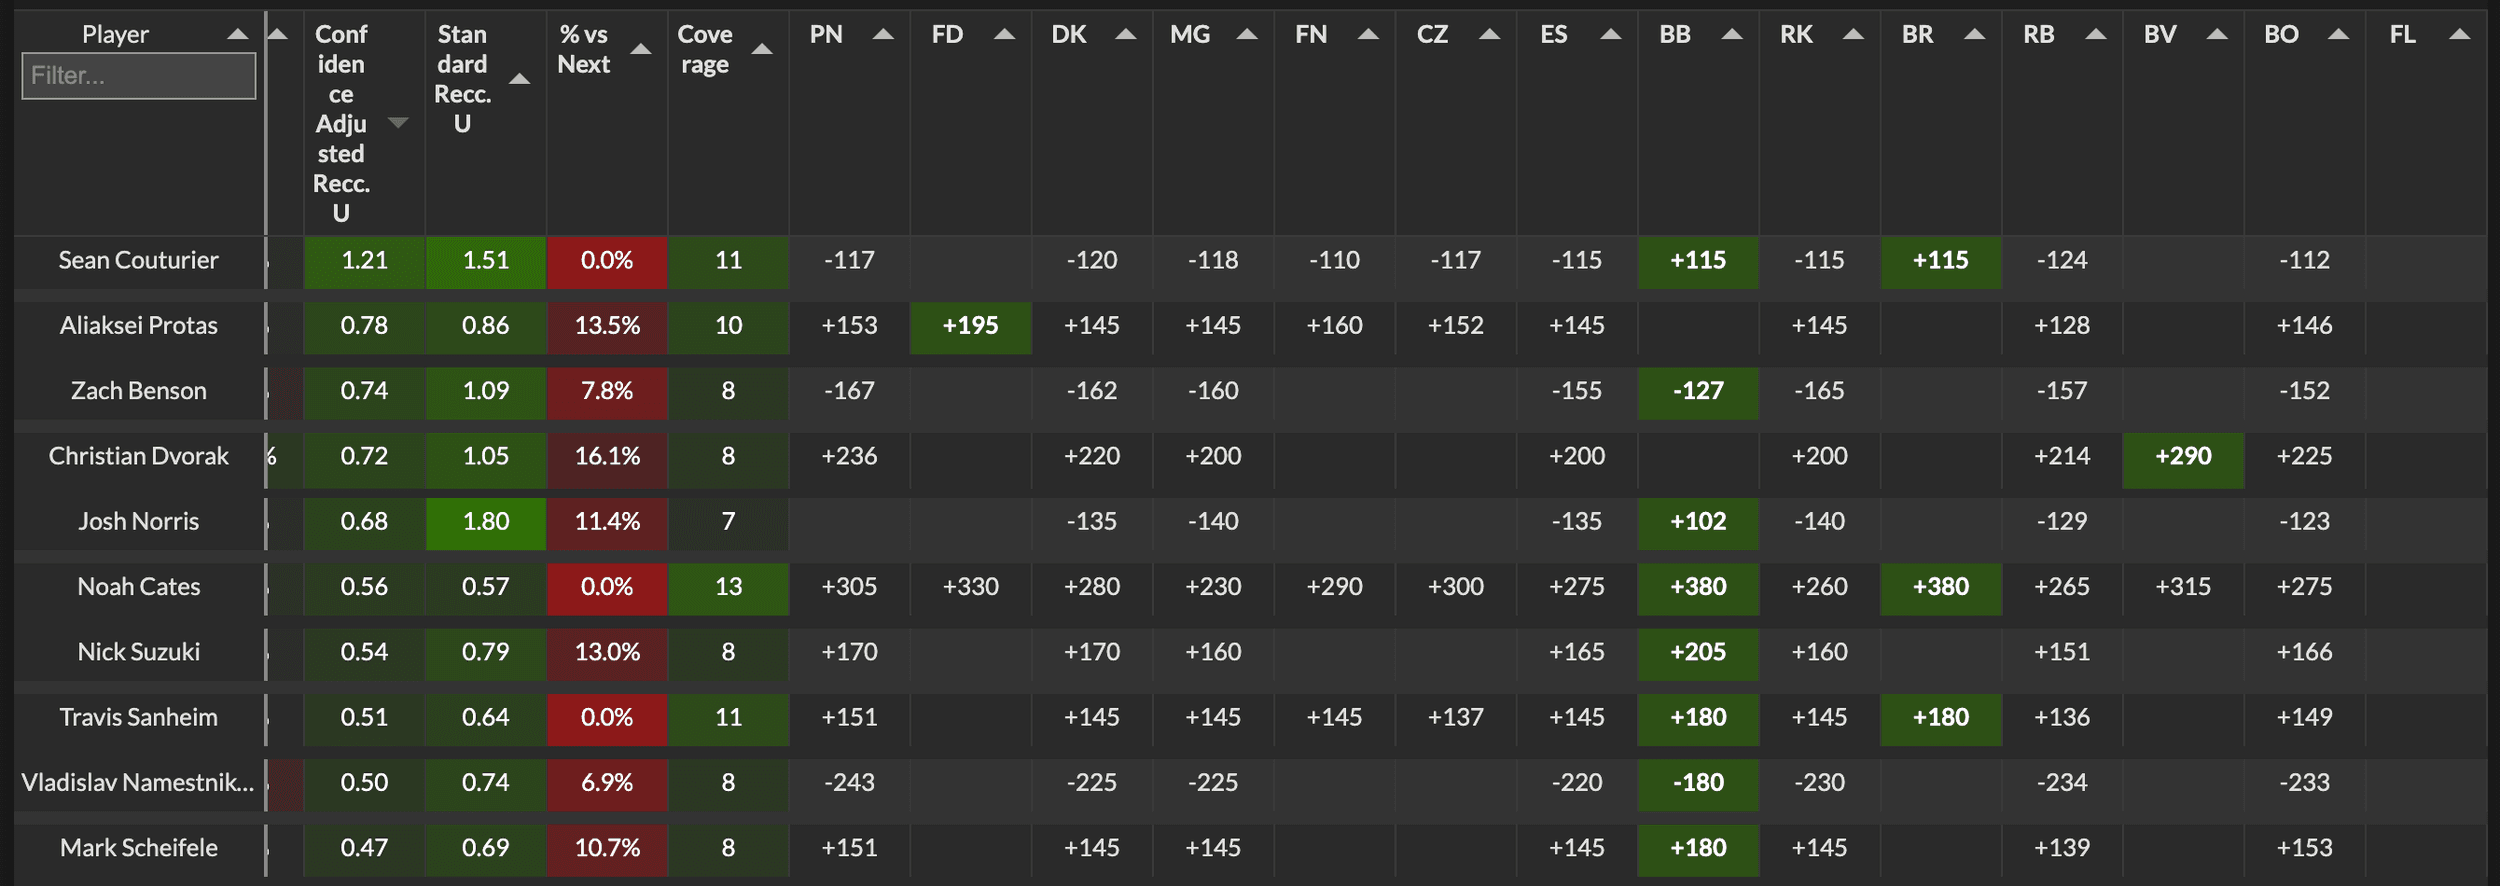
The remaining columns show the odds at each specific sportsbook:
-
PN = Pinnacle
-
FD = FanDuel
-
DK = DraftKings
-
MG = BetMGM
-
FN = Fanatics
-
CZ = Caesars
-
ES = TheScore
-
BB = BallyBet
-
BR = BetRivers
-
HR = Hard Rock
-
BO = BetOnline
-
RB = ReBet
-
BV = Bovada
-
FL = Fliff
-
B3 = Bet365
-
CI = Circa
-
Exchanges and prediction markets: KS = Kalshi, NV = Novig, PX = ProphetX, PM = Polymarket
-
Others: BP = betPARX, CS = Courtside, MB = MyBookie, and Hard Rock's state books HF (Florida), HA (Arizona) and HO (Ohio)
(Available books vary by sport and market)
These let you see:
-
What odds are available at YOUR books
-
The spread between sharp books (Pinnacle) and soft books
-
Where the outliers are
-
Best Book(s) are highlighted in GREEN
Exchange fees. Kalshi, ProphetX and Polymarket charge fees, so their posted price isn't what you actually get. On every Value Finder board (player props and Main Lines), best book, EV and Recc. U use the after-fee price, while the cell keeps the posted price with a small fee tag; hover it (or tap on mobile) to see the price after fees. Novig charges no fee on pre-game bets.
⚠️ "Price looks wrong." Now and then a sportsbook's feed glitches and posts a price that is far longer than every other book (say +1050 where everyone else is −230). We still show that price, with a small ⚠️; hover it (or tap on mobile) to see why. It is never used as the best price, never counts toward EV or Recc. U, and bets placed off it are left out of our tracked results. If a book's whole feed looks broken on one update, all of its prices that update get the ⚠️.
Deep Dive: Understanding EV%#
EV% (Expected Value Percentage) tells you your mathematical edge on a bet.
-
EV 5% means for every $100 you bet long-term, you expect to profit $5
-
EV 10% means for every $100 you bet, you expect to profit $10
-
Higher EV = bigger edge
This is calculated by comparing the odds you're getting (Best Odds) to the Fair Odds. If Fair Odds are +300 and you're getting +360, you have positive EV because you're being paid more than the true probability suggests.
More in +EV Betting Basics below, and even MORE in What is +EV Betting?
Deep Dive: Conf. Adj. Recc. U vs Std. Recc. U#
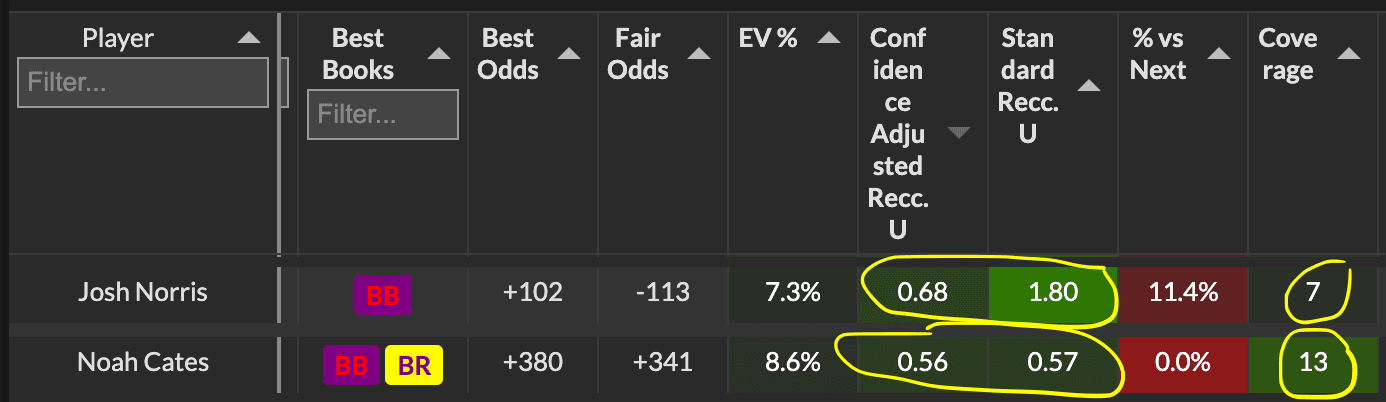
This is one of the most important distinctions to understand.
Std. Recc. U (Standard) is what you'd get if you plugged the Best Book odds and Fair Value odds into a quarter Kelly calculator. It's the "pure math" recommendation.
Conf. Adj. Recc. U (Confidence Adjusted) takes that Standard recommendation and scales it down based on how confident we are in the Fair Value calculation.
Here's why this matters:
The Fair Value odds are calculated based on which books are reporting odds for that market. If we have odds from Pinnacle, FanDuel, DraftKings, BetMGM and many other books, we're very confident in that Fair Value. If we only have odds from a couple of soft books? We're less confident.
Conf. Adj. Recc. U will always be LESS THAN or EQUAL TO Std. Recc. U.
This builds in a buffer. If only a few soft books are reporting, we don't get overly excited by seeing one as an outlier - because we don't trust those books as much to forecast event probability accurately.
My recommendation: Sort by Conf. Adj. Recc. U. It's the more conservative, safer metric that accounts for market uncertainty.
For more about setting and managing your bankroll to determine what your unit should be and therefore how much to wager per bet, please read Bankroll Basics!
Deep Dive: % vs Next Book#
This column highlights potential outliers and mispricings in the market.
% vs Next shows how much better the Best Book's odds are compared to the next closest book. The higher this number, the more that Best Book is an outlier compared to the rest of the market.
-
% vs Next = 0-10% - Normal spread, multiple books are close
-
% vs Next = 30%+ - The Best Book is significantly out of line with everyone else
-
% vs Next = 50%+ - Major outlier, potentially a mis-priced line
Why this matters:
When a book is way out of line with the rest of the market, it could mean:
-
They haven't adjusted their line yet (opportunity!)
-
They have different information (less likely)
-
It's a pricing error (rare but happens)
High % vs Next opportunities are often the juiciest - you're catching a book that's mispriced relative to the consensus. These are the ones you want to grab quickly before they correct.
Book Settlement Notes#
Not every book settles a prop the same way. Some have house rules that change the outcome of certain bets, and the Value Finder flags them so you know before you bet.
The * on a book column#
A * on a book's column header (and next to that book in the Book Columns picker) means that book has a house rule for this sport that changes how some props settle. Hover the header to read it. For example:
- FanDuel — Super Sub (soccer): if your player is subbed off, your bet transfers to the player who replaces him.
- Fanatics — Fair Play (NFL, NBA, WNBA, NHL, MLB, soccer): voids props when a player leaves the game early injured. When Fanatics runs its Fair Play Max promotion, it's shown with the date it's valid through.
- DraftKings — Early Exit (NBA, NFL, MLB): NBA and NFL cover injury exits in the first half. In MLB it covers a starting batter who leaves before his 2nd plate appearance, or a starting pitcher who leaves before facing five batters.
- BetMGM — Bet Defense (NBA, NFL): covers injury exits in the first quarter.
- Hard Rock (soccer): the player must start.
Market tags: FG and REG#
Some markets carry a tag on the price itself, and on the Best Book badge when that book is the best price:
- FG — NBA first basket at a book that settles on the first field goal (free throws don't count).
- REG — NHL first goalscorer at a book that counts regulation only.
Tap or click the tag to read the rule.
What it means for you#
- Fair value doesn't change. We price every book against the same fair value.
- Where a rule can be checked from the box score, our results follow it. First basket (field goal vs point), NHL first goal (overtime), MLB "left before his 2nd plate appearance" at DraftKings and Fanatics, and MLB pitchers who didn't start at books that void them — each bet is graded on that book's own rule.
- Injury-based voids can't be seen in a box score, so those bets are graded on the box score as normal. Treat that protection as a bonus on top.
In simple terms: same price, different fine print — the * and the tags tell you when the fine print matters.
Betslip Deep Linking#
You don't have to flip over to your sportsbook and retype a bet by hand. Betslip deep linking lets you tap an opportunity right in the Value Finder and land in your book's betslip with the selection already loaded.
Look for the ↗ arrow — it marks every spot that supports one-tap betslip linking:
-
Book odds cells — any individual book's odds with a ↗ is a live link. Tap FanDuel's price on a row and FanDuel opens with that exact bet in your betslip.
-
Best Odds column — links straight through to whichever book holds the best number.
-
Player Details → All Props — the best book badge on each prop is a deep link too, so you can research a player and bet without leaving the panel.
-
Parlay HQ — when you build a parlay, each book gets its own betslip link to load every leg at once.
Major books such as DraftKings, FanDuel, BetMGM, Caesars, TheScore, Hard Rock and Novig are supported. It works on desktop and mobile (on mobile it opens your sportsbook app). Books without the arrow simply don't offer betslip linking.
One reminder: deep links load your selections, but odds move fast — always confirm the price and your stake in the sportsbook before placing the bet.
How to Use the Value Finder#
Sorting#
Click any column header to sort by that column. Click again to reverse the sort order.
My default: Sort by Conf. Adj. Recc. U, high to low. This puts the highest-confidence, highest-value opportunities at the top.
Other useful sorts:
-
EV% - See the highest mathematical edges
-
Game Time - Find opportunities for games starting soon
-
Coverage - Prioritize well-covered markets
-
% vs. Next - Look for outliers
Filtering#
Use the filter row below the headers to narrow down opportunities.
Filter by Player: This is the only free-text search field. Type any part of a player's name to find them.
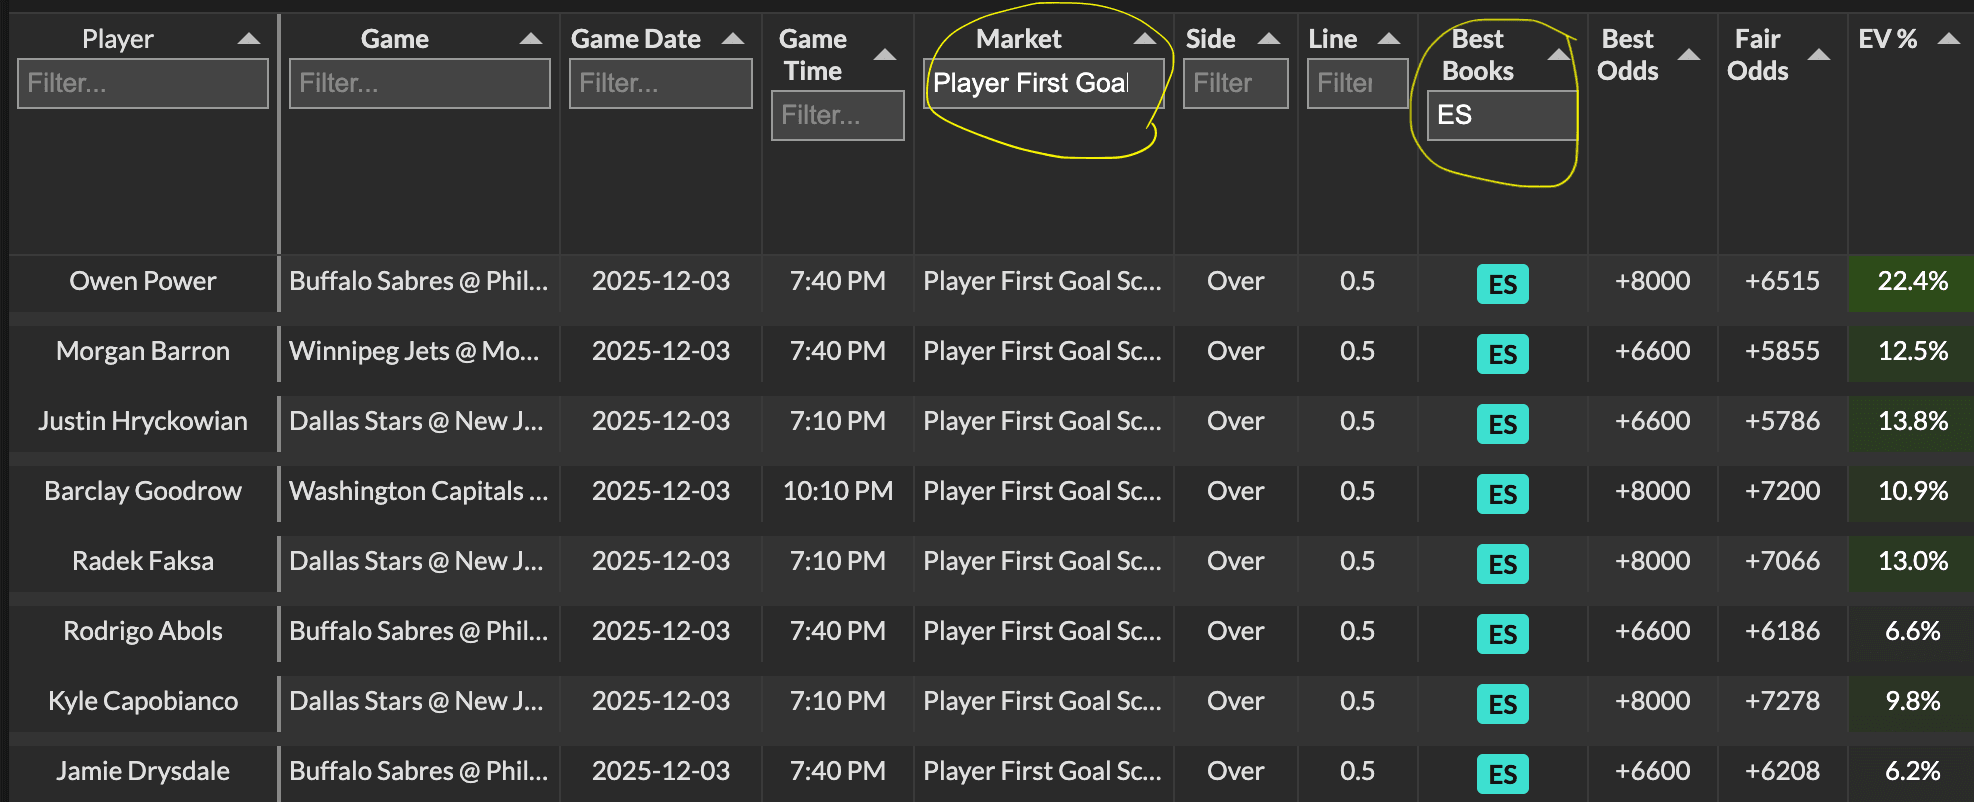
Filter by Book, Market, Game, etc.: These use dropdown menus. Click the dropdown and select from the available options.
Multi-Select Filtering: You can select multiple values from the same dropdown! For example:
-
Select both "DK" and "FD" in the Best Book filter to see opportunities at either book
-
Select "Points" and "Assists" in the Market filter to see both market types
Select All / Clear All: Every multi-select dropdown includes a Select All button at the top. This is useful when you want to see almost everything — click Select All, then un-check just the one or two options you don't want. Much faster than checking them one by one. The Clear All button removes all selections.
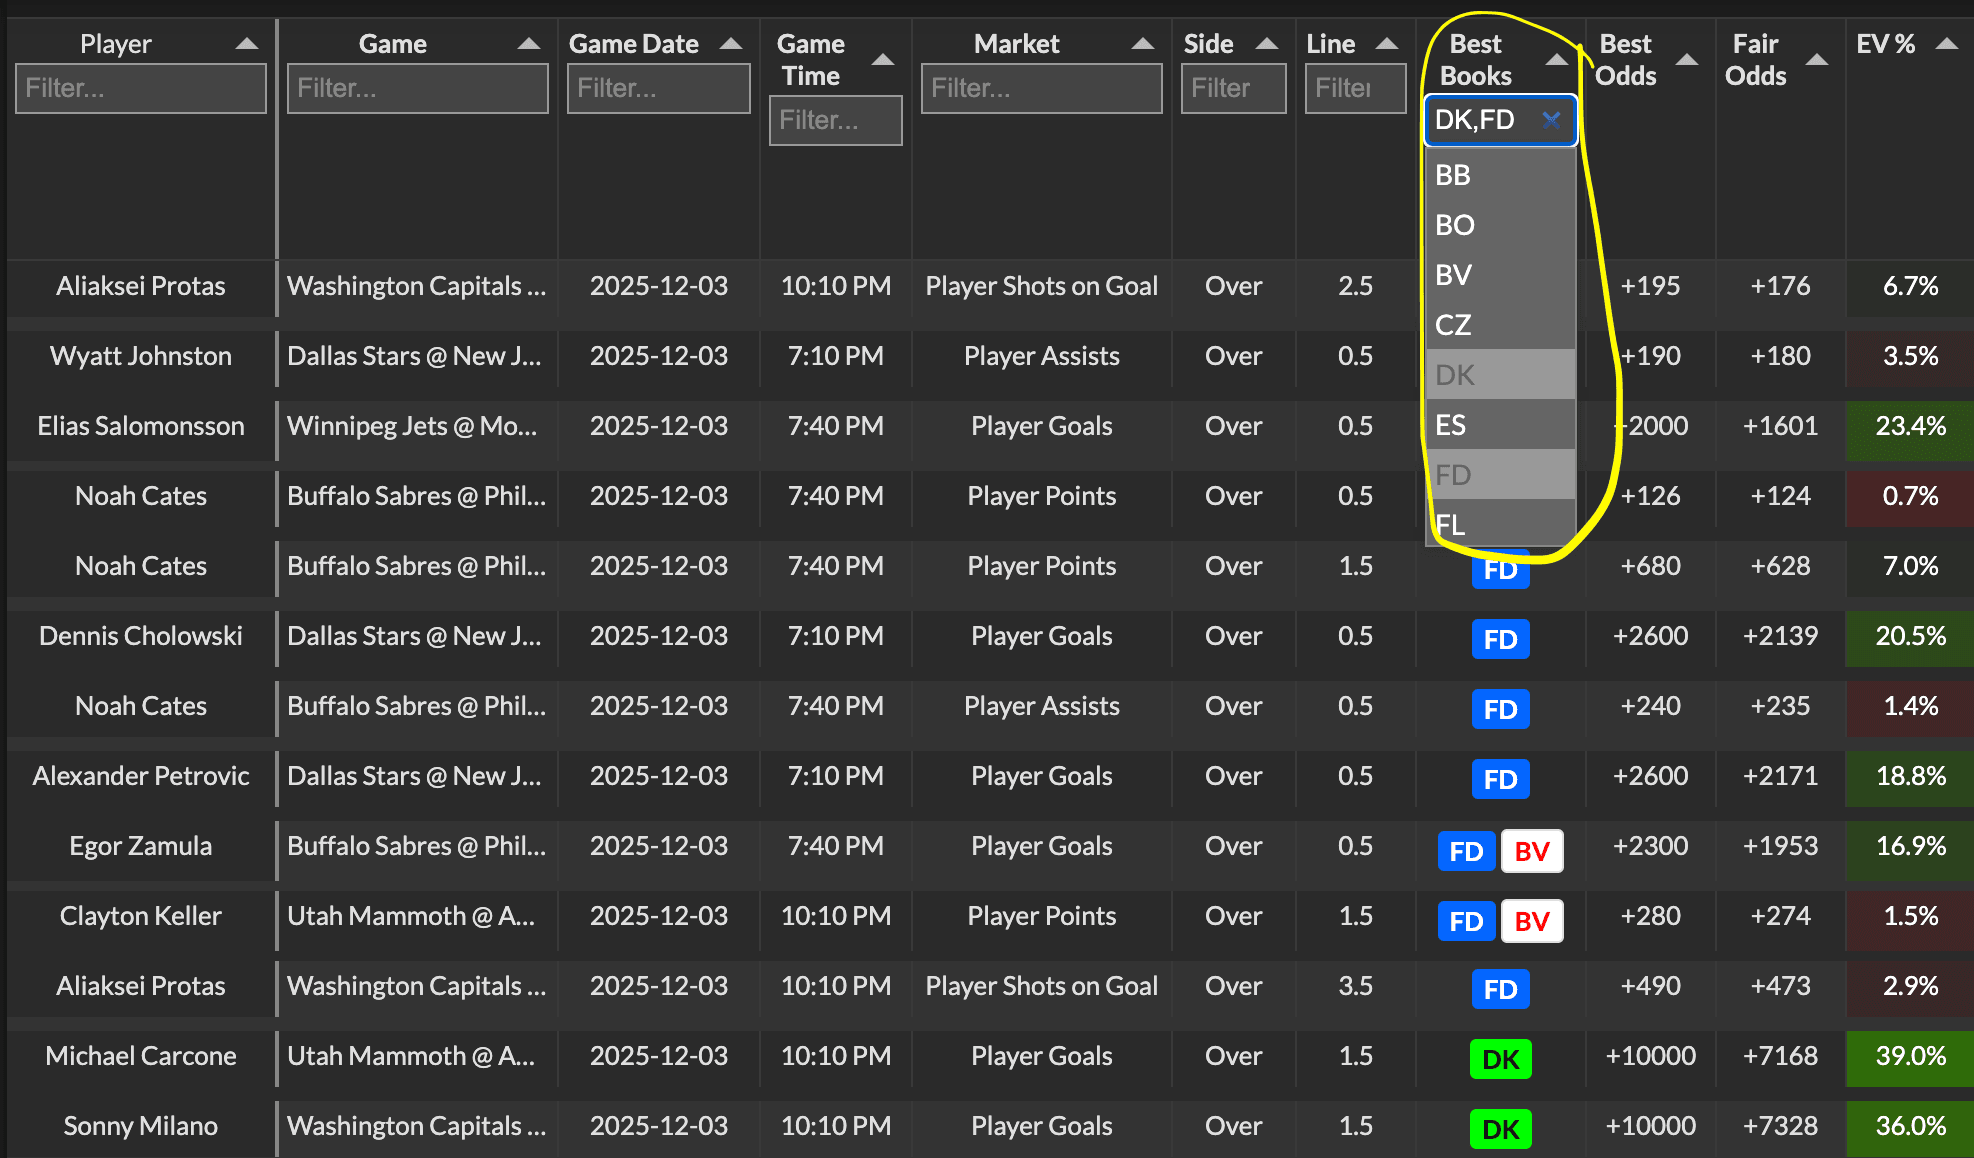
Combining Filters: Filters work together across columns. You can filter by Book AND Market AND Game simultaneously to narrow down to exactly what you're looking for.
Pre-Made Filters#
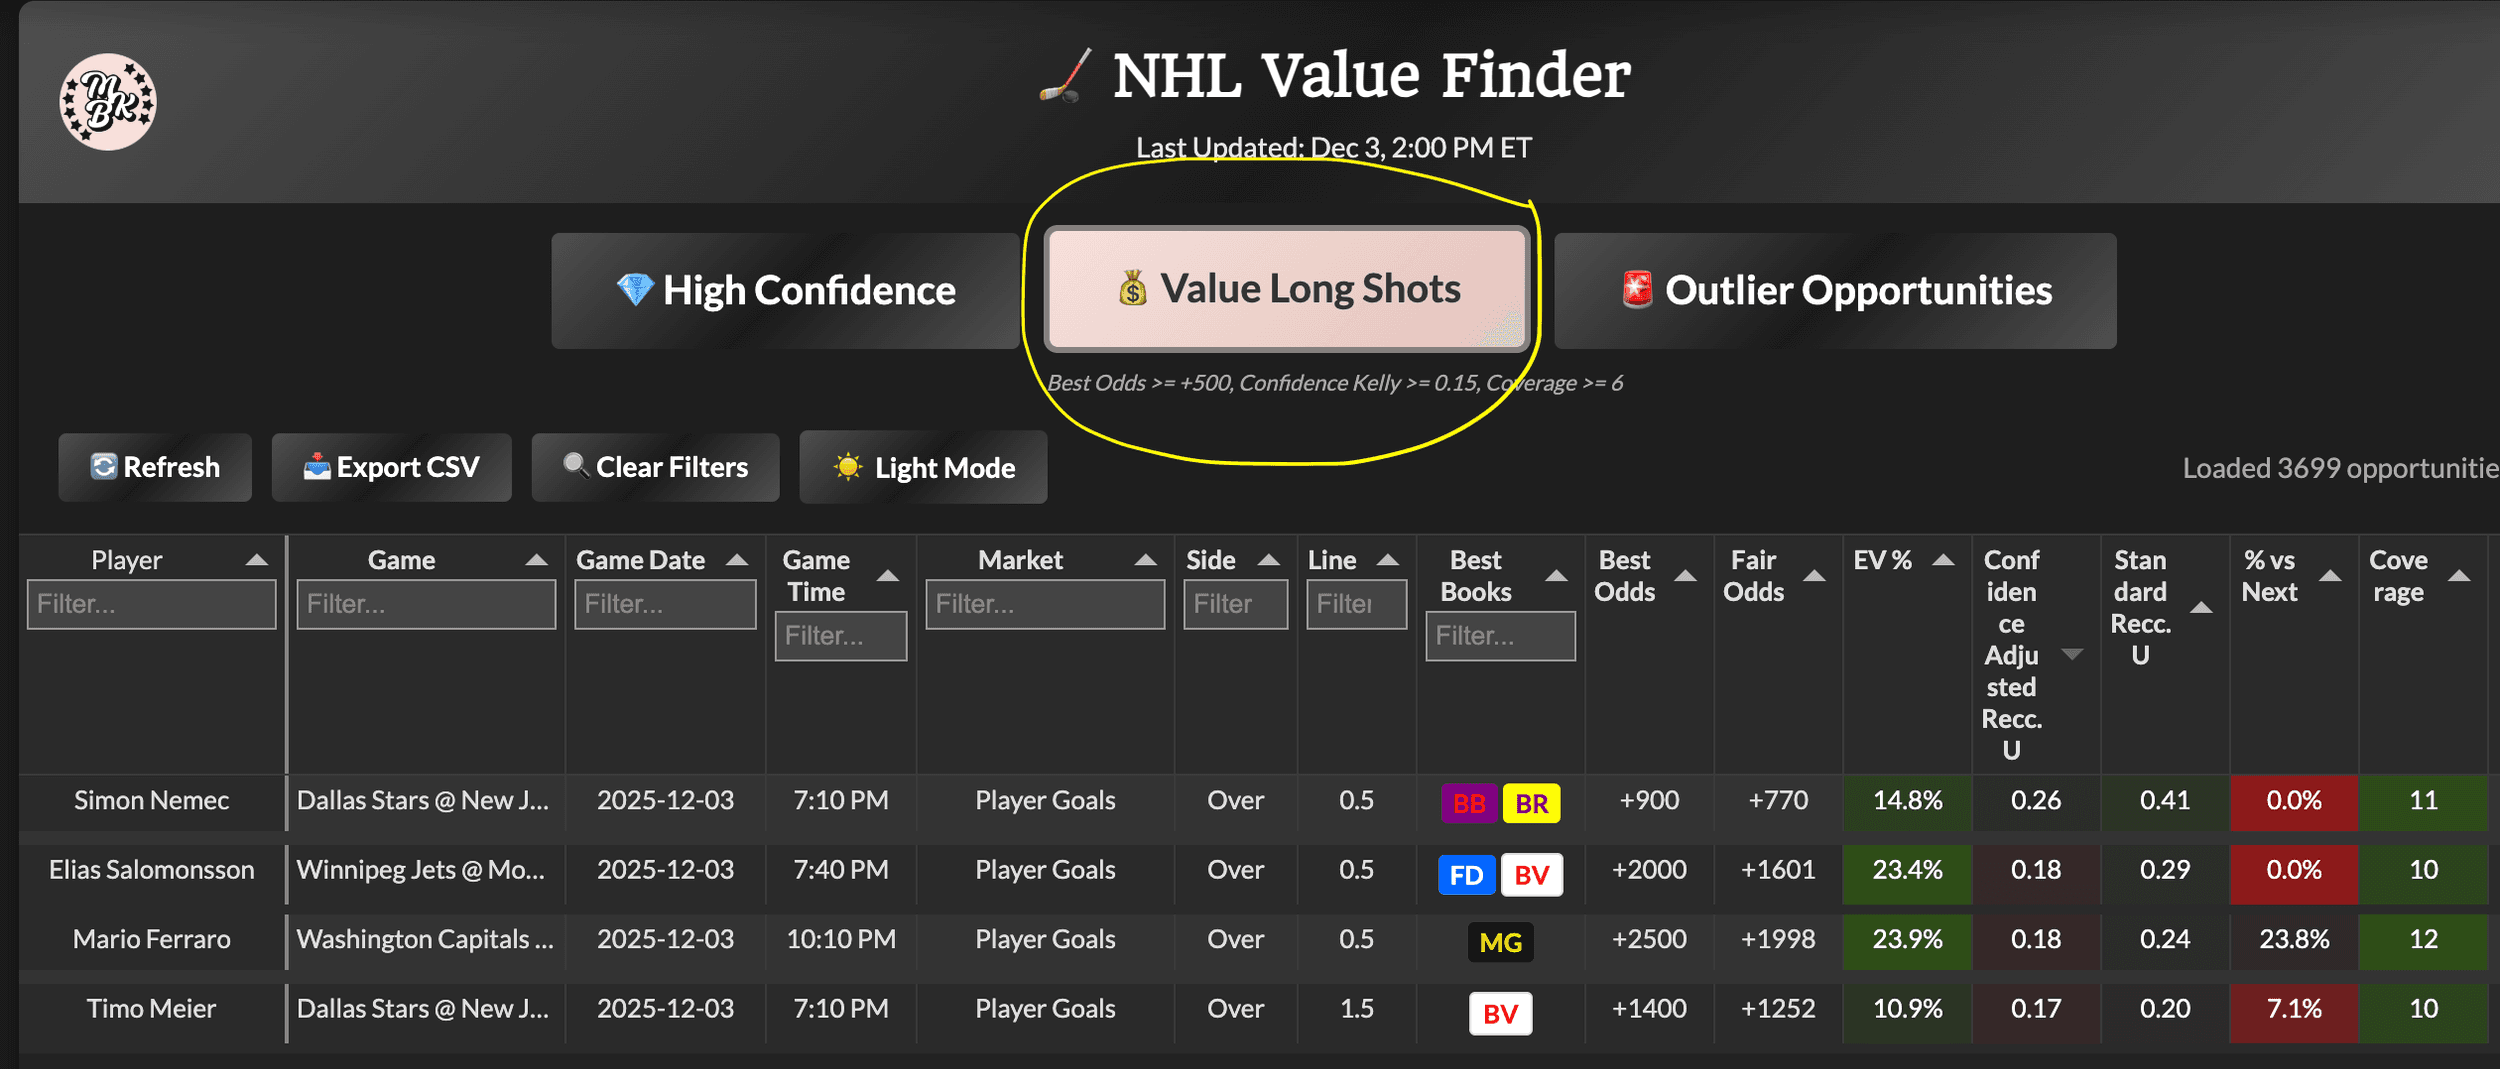
Each Value Finder has pre-made filter buttons that surface helpful cohorts of opportunities. Hover a button to see its exact criteria.
-
💎 High Confidence: opportunities with high Conf. Adj. Recc. U on lines plenty of books are pricing. The cream of the crop: the plays where we most trust the Fair Value calculation.
-
💰 Value Long Shots: longer-odds opportunities that still have a meaningful +EV edge.
-
🚨 Outlier Opportunities: bets where one book is significantly out of line with the market (high % vs Next). Potentially mispriced lines you want to grab before they correct.
-
🔥 Steaming +EV: lines that are still +EV and that the market has shortened over the last 24 hours, biggest moves first. It opens the Movement columns so you can see the numbers. See Line Movement (Steaming).
Boards with a projection model also have 🧠 Model Edge and 💎🧠 Double Edge buttons; your sport's guide covers them.
Click a filter button to apply it. Click 🧹 Clear to reset and see all opportunities again. You can also apply any of the other filters while using a pre-made filter (for example, search for “Player Goals” within “Value Long Shots”)!
Toolbar Buttons#
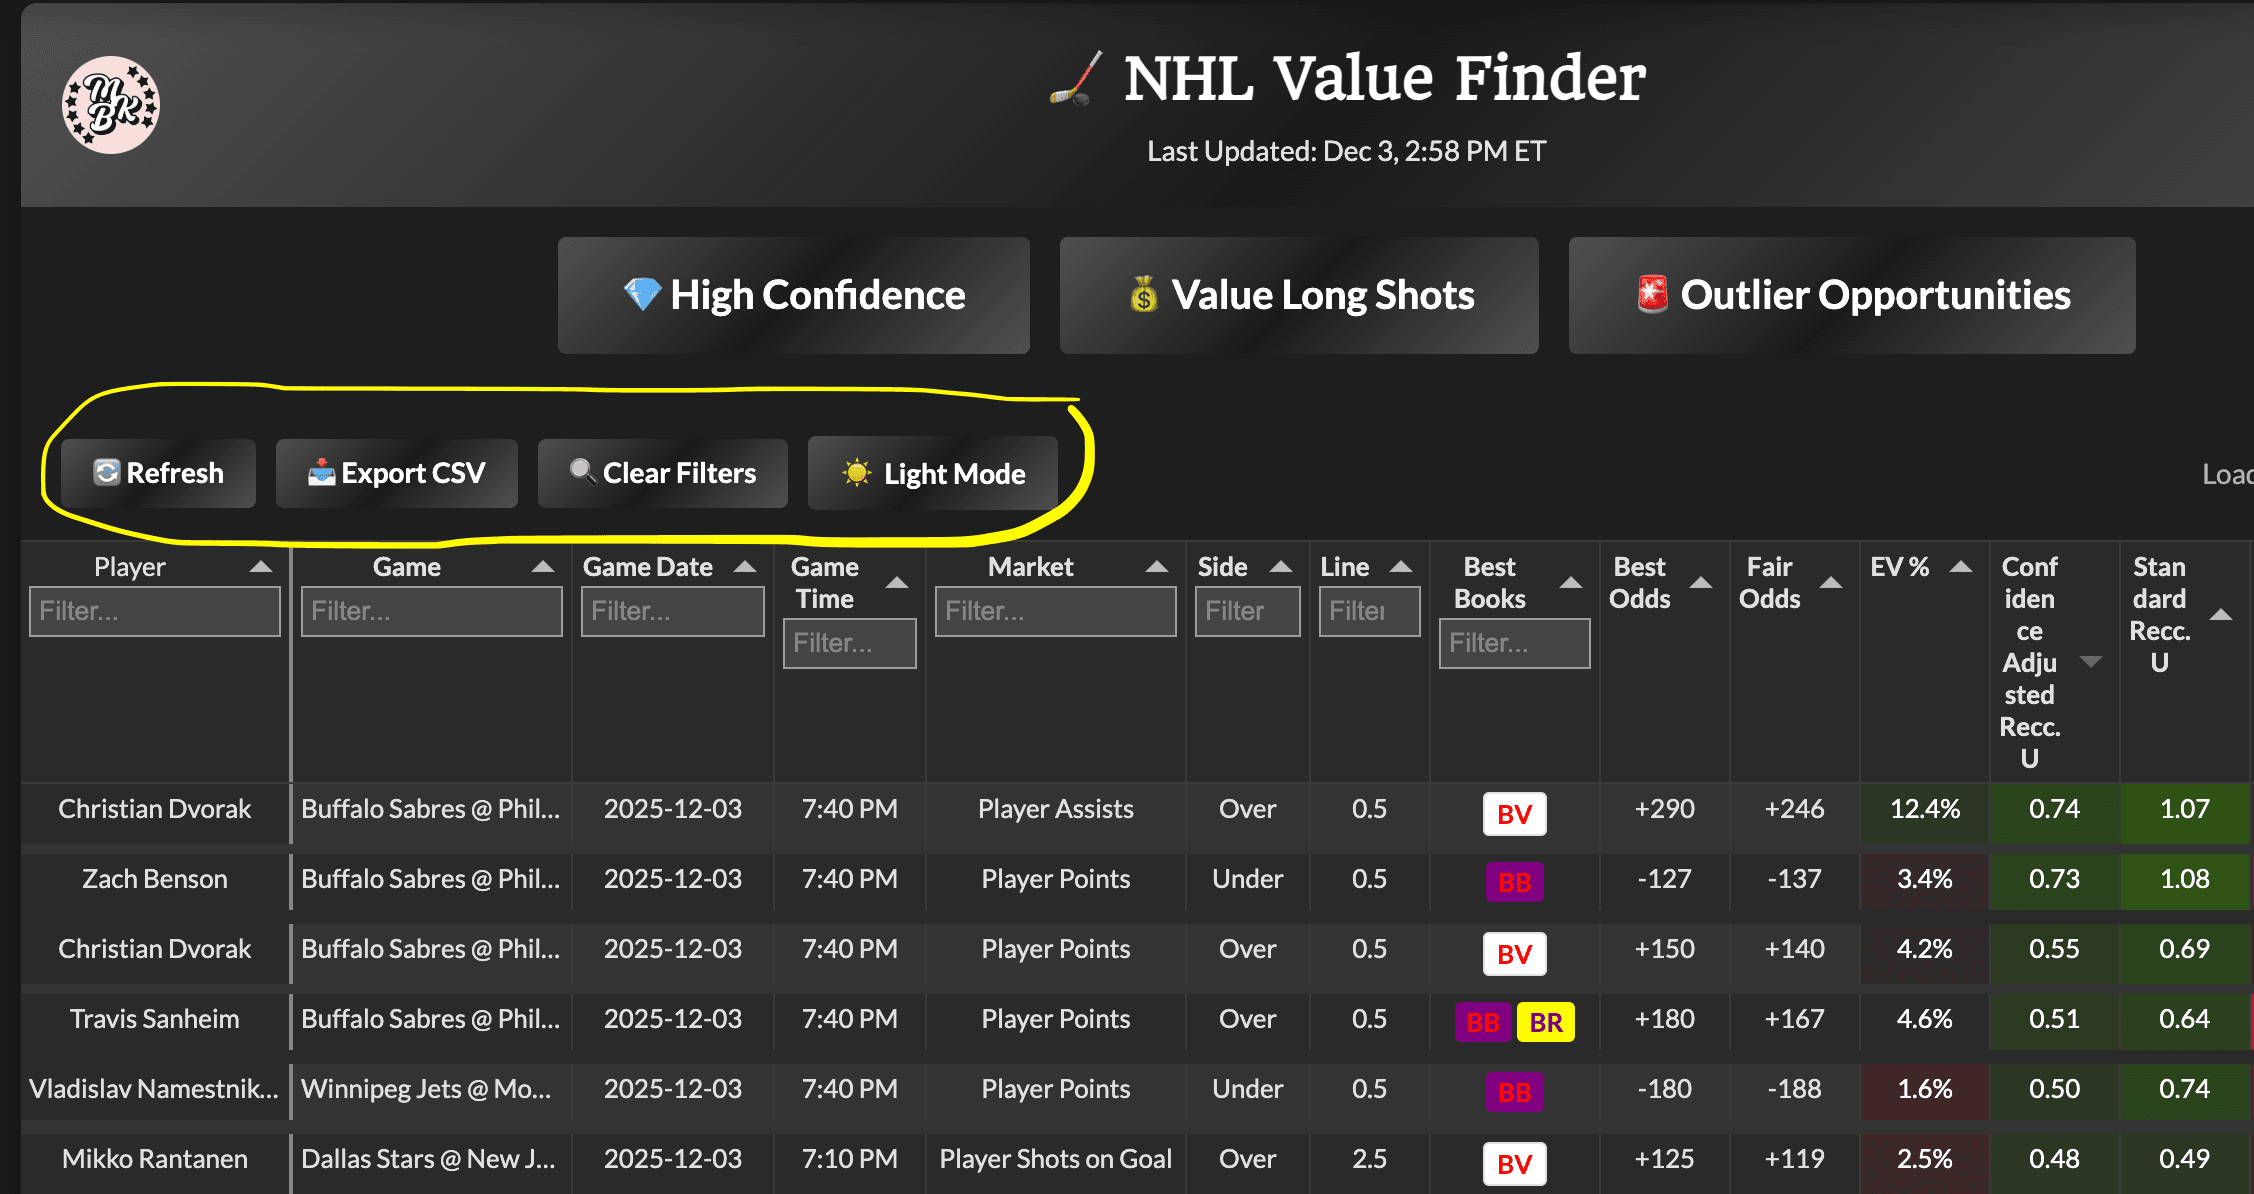
The Value Finder has a few utility buttons to help you work more efficiently:
🔄 Refresh - Pulls the latest data from the database. Use this to see new opportunities that have come in since you loaded the page. The Value Finder also refreshes itself regularly, so you may notice it update without needing to hit this button!
📥 Export CSV - Downloads all current opportunities as a CSV file. Useful if you want to analyze opportunities in a spreadsheet, track your own records, or save a snapshot of what was available. Available on mobile as well as desktop.
📈 Movement - Shows or hides the line-movement columns: how far each line has moved over recent windows and since it opened. The 🔒 lock next to it keeps them on across visits. See Line Movement (Steaming).
💧 Liquidity - Shows or hides the exchange price for each line and how much you can bet there. The 🔒 lock keeps them on across visits. See Liquidity.
💵 Exchange $ - Pick an amount, then optionally price the board only from prices that can take it, or hide thin lines. All off by default. See The 💵 Exchange $ button.
⚖️ FV Mode - Chooses what "fair value" means for EV and Recc. U: Market FV (our de-vigged, sharpness-weighted consensus, the default), Market Average (the plain average of every realistic price on the line, exchanges included, margin left in; glitch and out-of-line prices and your excluded books are left out, and it shows "—" when too few independent sportsbooks price the line. A reference view, not a recommendation: the edge reads "vs Avg %", Recc. U shows "—", and nothing in it is tracked or posted), My FV (your own book weights), or any single book, de-vigged. Boards with a projection model also offer Model FV.
🧹 Clear - Resets all filters and sorting back to the default view. Quick way to start fresh if you've narrowed things down too much.
Light/Dark Mode Toggle - Switches between light and dark themes. Use whichever is easier on your eyes.
Odds Format (+/− · % · Both) - Controls how odds are displayed. +/− shows American odds (+150), % shows implied probability (40.0%), and Both stacks them with the percentage above the price. Handy because several exchanges quote in percentages - Both lets you read a mixed board without converting in your head. The color shading on the cells is based on the underlying price either way, so it doesn't change when you switch.
Main Lines Tab (Game Lines)#
Every sport with game lines has a 🎯 Main Lines tab in its Tool Suite, next to the Value Finder.
The 🎯 Main Lines tab is the Main Lines Value Finder, for game lines: moneyline, spread and total for every game in that sport, plus every alternate spread and total. It is the same tool as the Player Prop Value Finder (same columns, toolbar, filters, book columns, boosts, Kelly units, sparklines, line movement, betslip links and Parlay HQ), just with games instead of players. Quick filters, tuned for game lines: 💎 High Confidence (a higher coverage bar than props, because main lines are quoted by far more books), 💰 Value Long Shots (plus-money game lines with an edge; a +EV game line at long odds is rare, so this is often empty) and 🔥 Steaming +EV (still +EV after a real shortening in the last 24 hours; game-line prices move less than props, so the bar for a "real" move is higher). 🧹 Clear resets every filter.
Reading a row. The Bet column reads like a betslip line: Chiefs (moneyline), Chiefs -3.5 (spread), Over 47.5 (total). Market says which kind of bet it is, and Line holds the number so you can sort and filter by it. Lines are full game, settled the way the books settle them.
Main lines vs alternates. Alternates are simply more rows. The Market filter lists Moneyline, Spread, Total, Alt Spread, Alt Total (hockey says Puck Line, baseball Run Line, soccer Handicap and 1X2), all ticked by default. Want main lines only? Untick Alt Spread and Alt Total. Want only alternates? Untick the other three.
Fair value on game lines. Market FV is de-vigged from the books on that exact line and weighted by sharpness, with Pinnacle as the anchor. A line needs enough sharp-weighted books before we show a fair value or an edge. With fewer, you still see every book's price, with no fair value and no edge, rather than a guess. Far-out alternate lines are often priced by only one or two books, so expect more blanks there.
Exchange fees are built in, exactly as on the props board: best book, EV and Recc. U use the after-fee price, and the cell shows the posted price with a fee tag. See Individual Book Odds.
Settings are separate. Your book columns, custom weights and saved filters on Main Lines are kept separately from the prop Value Finder, so setting up one never changes the other.
Sparklines#
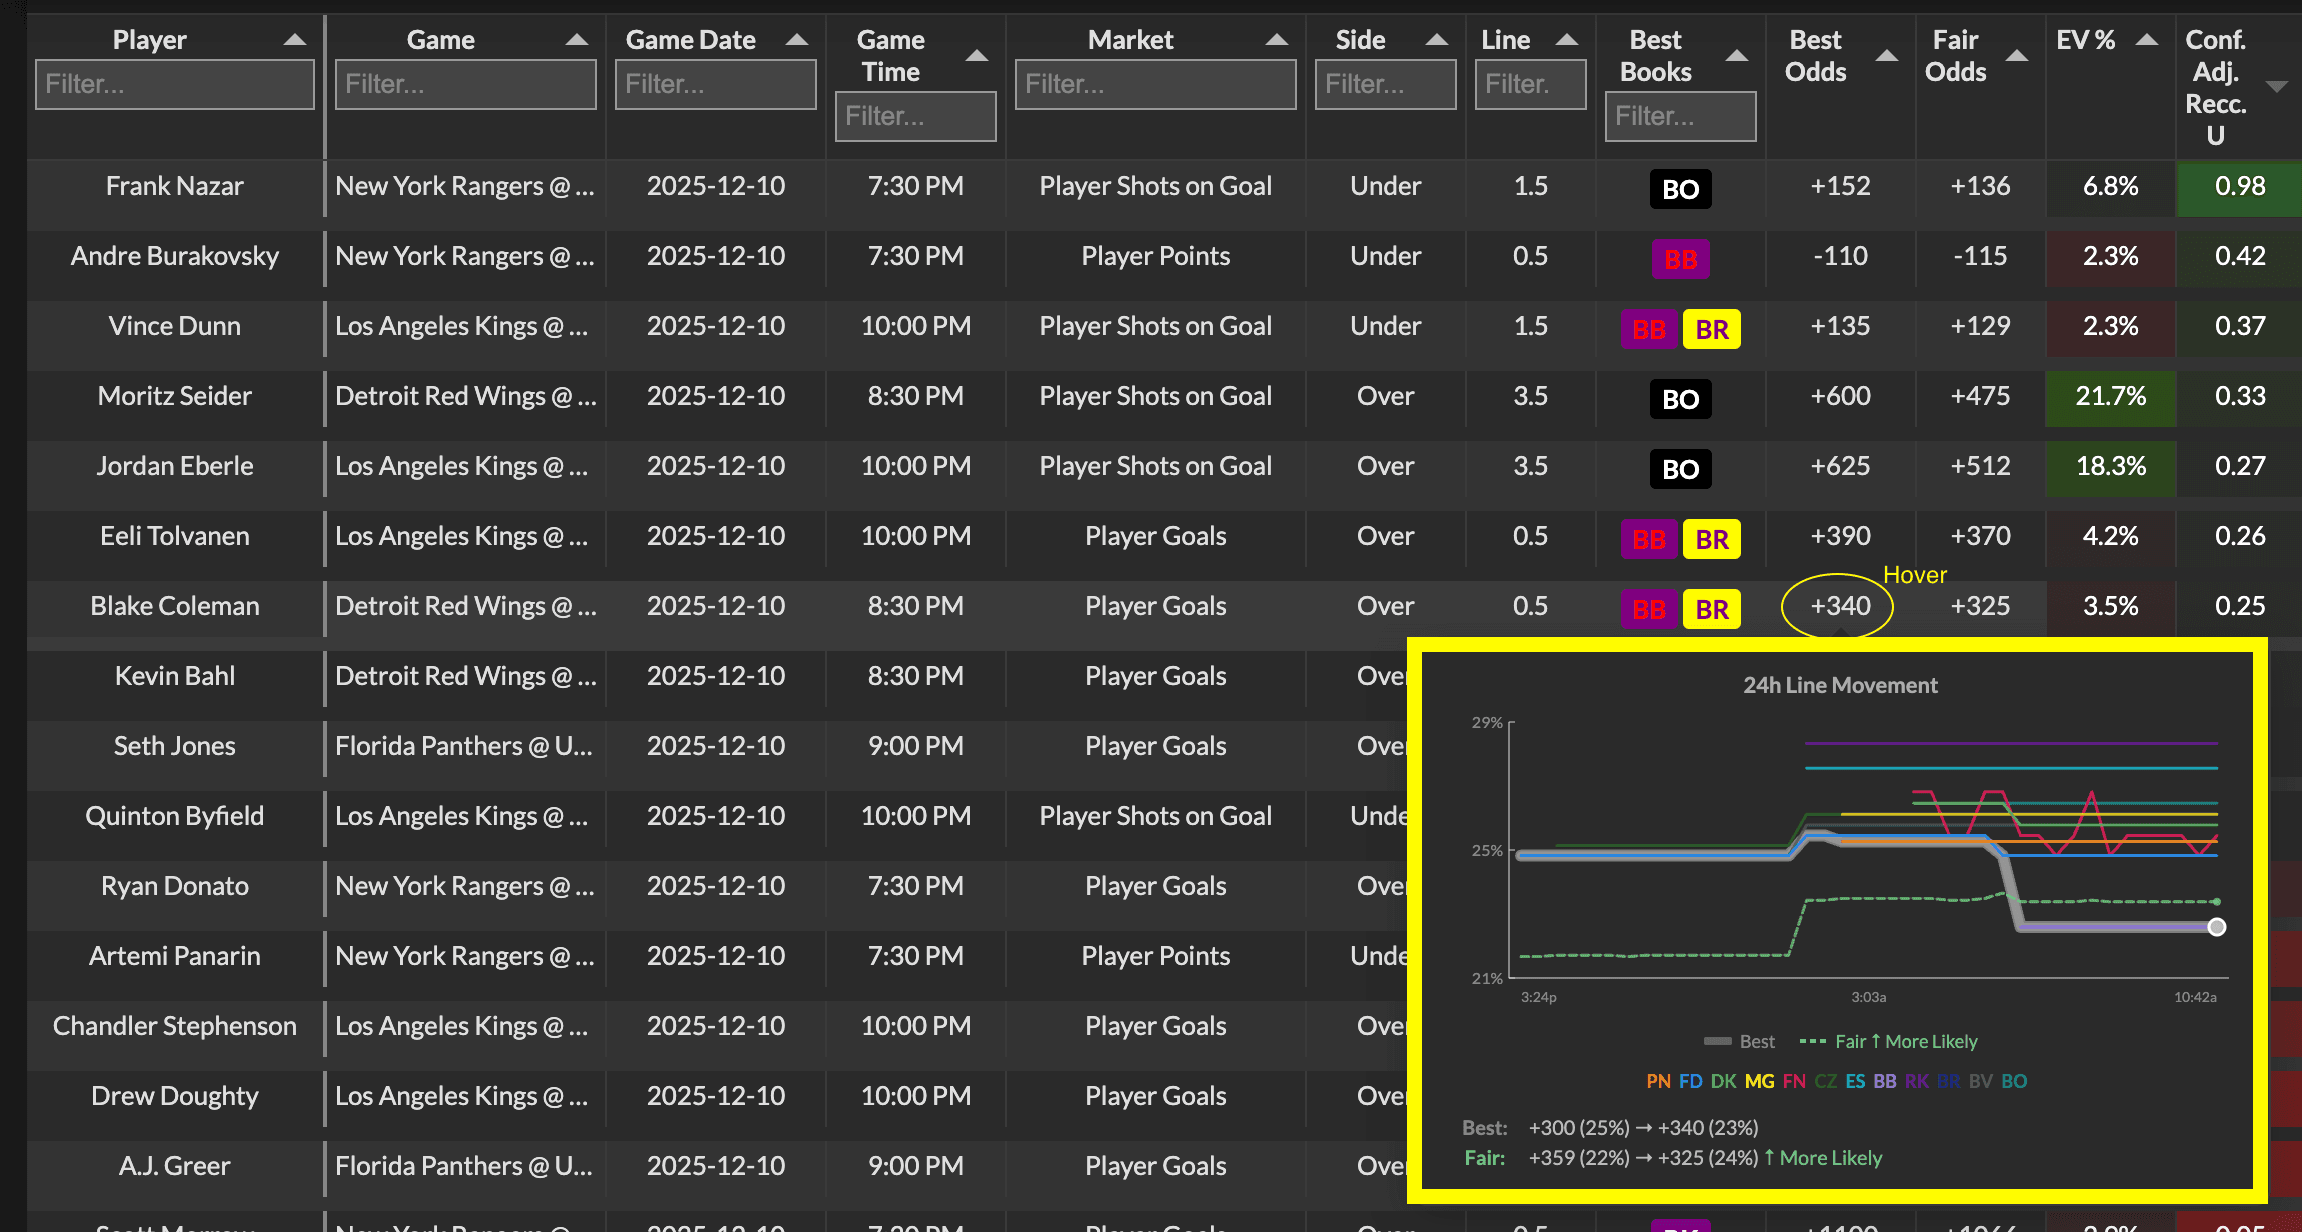
One of our most powerful features is the ability to see how odds have moved, right from the Value Finder table. The chart covers a line's recent history, and every point shows its date and time so you always know which day you're reading. This gives you extra context on whether a line is moving in your favor or if you should act quickly before an opportunity disappears.
How to Access Sparklines#
On Desktop: Simply hover your mouse over any odds value. You can hover over:
-
The Best Odds column to see overall line movement across ALL books at once
-
Any individual book column (PN, FD, DK, etc.) to see that specific book's line history
On Mobile: Tap any odds value with a dotted underline to open a sparkline popup.
Understanding the Chart#
The sparkline shows you how lines have moved throughout the day. Here's what you're looking at:
The Vertical Axis Is Probability#
This is important to understand: the chart shows implied probability, not odds directly. Probability is the inverse of odds:
-
Higher probability = Lower odds (the event is more likely to happen)
-
Lower probability = Higher odds (the event is less likely to happen)
So if you see a line moving UP on the chart, that means:
-
The probability of the event is INCREASING
-
The odds are DECREASING (getting shorter)
And if a line is moving DOWN:
-
The probability of the event is DECREASING
-
The odds are INCREASING (getting longer/higher payout for you as a bettor)
The Lines on the Chart#
In the Best Odds sparkline, you'll see multiple lines:
-
Gray glow line: This is the "Best Odds" line showing the best available price at any moment (which might come from different books over time)
-
Colored lines: Each color represents a different sportsbook (PN=orange, FD=blue, DK=green, etc.)
-
Dotted line: This is the Fair Value line showing where the "true" odds should be
In individual book sparklines, you'll see:
-
Solid colored line: That book's odds over time
-
Dotted line: Fair value for comparison
The Colors and Trend Indicator#
The Fair Value line shows a trend indicator:
-
Green (More Likely): The market thinks this outcome is becoming more probable
-
Red (Less Likely): The market thinks this outcome is becoming less probable
-
Gray (Stable): Only a small change - the market hasn't moved much
Reading the Chart#
Think of the sparkline as a story of how the market has evolved. Here's how to read it:
Example 1: Finding a Slow Book#
Imagine you see the Fair Value line (dotted) moving UP throughout the day - the market thinks this outcome is becoming more likely. But one book's line is staying flat or barely moving. That book hasn't caught up to the market yet! They're "slacking" on updating their odds, which means you might be getting a better price than you should. This is often a good opportunity.
Example 2: Spotting Steam Moves#
If you see all the book lines suddenly drop at the same time (especially in the last few hours), that's called a "steam move" - sharp bettors have hit this market hard. The opportunity might be disappearing fast, so act quickly if you want in.
Example 3: Comparing Books#
Look at where each book's line sits relative to the others. If most books are clustered together but one book is noticeably higher on the chart, that book is offering worse odds (higher probability = lower payout). But if a book is lower on the chart than others, they might be offering better value.
What to Look For on a Sparkline#
Value Windows: If a book's line (solid) is sitting BELOW the fair value line (dotted), you're getting better odds than the "true" probability suggests. The bigger the gap between them, the more value you're getting!
Steam Moves: Sharp, sudden moves in one direction across multiple books = sharp money hitting the market. These opportunities can disappear quickly.
Book Timing: Individual book sparklines show when each sportsbook first released their odds. Some books are faster to market than others, and early lines can sometimes offer more value before the market corrects.
Convergence: Watch for book lines converging toward fair value as game time approaches. Markets become more efficient closer to the event.
Sparkline Pro Tips#
-
Compare books in the Best Odds view: The multi-book view lets you see at a glance which books are moving together and which ones are lagging behind. A lagging book = potential opportunity.
-
Check the timestamps: The three time labels along the bottom help you understand the timeline. A move that happened 20 hours ago is very different than one happening in the last hour.
-
Use with Kelly: Combine sparkline analysis with the Conf. Adj. Recc. U column. A high Kelly bet that's also showing a book lagging behind fair value is a strong signal.
-
Fair value is your anchor: Always compare book lines to the fair value dotted line. The fair value shows where the market consensus is - any book significantly different from that is either offering value or overpriced.
-
Don't overthink it: The sparkline is just one more data point. If the numbers look good (high EV%, good Kelly), the sparkline is extra confirmation, not a requirement.
Line Movement (Steaming)#
"Steaming" is when the market shortens a price — more money and more books coming in on one side, so the odds get shorter. The 📈 Movement columns show how far each line has moved, so you can see what's steaming (and what's drifting) right next to the odds.
How to open it: click 📈 Movement in the toolbar, right next to Player Info. A group of columns opens right after Coverage, beside the odds:
| Column | What it shows |
|---|---|
| 2h pts · 4h pts · 6h pts · 12h pts · 24h pts | How far the line moved over that window (some boards show only the longer windows) |
| Open pts | How far it has moved since the market opened |
Click 📈 Movement again to hide them. To keep them on every time you visit, click the 🔒 lock next to the button — same as Player Info.
How to read the numbers: each one is in percentage points of chance.
- +1.5 means the market now gives it 1.5 more points of chance than it did — for example, from 20% to 21.5%. The price got shorter. That's steam. Shaded green.
- −1.5 means it drifted — the market likes it less, and the price got longer. Shaded blue.
- — (blank) means there isn't enough market behind the line to call it a move. See below.
Every column sorts and filters like any other — click a header to sort by the biggest movers, or use the range filter to set a minimum.
What counts as movement — and what doesn't:
- Only books that had odds the whole time are counted. When a sportsbook adds or pulls its odds, our fair value can jump even though nobody changed their price. That's not the market moving, so it isn't counted here.
- Sharp books count for more. A move by a sharp book like Pinnacle carries more weight than the same move by a smaller book — the same weighting we use for fair value.
- It needs a real market. Enough books have to have had odds the whole time — one or two books moving on their own isn't steam, so it shows as blank. A freshly posted line is measured from the point enough books had posted odds, not from the very first book to post.
The yellow ⚠ on the 24h column: this shows when our fair value moved a different amount than the market did — usually because a sportsbook added or pulled its odds. It's a heads-up that this line's EV% changed more than the market actually moved, so treat a sudden EV% jump on that line with a little caution.
🔥 Steaming +EV filter: in the preset buttons. It shows lines that are still +EV and that the market has shortened in the last 24 hours, biggest moves first — the market is moving toward the bet and a book hasn't caught up yet. It opens the Movement columns for you. Click it again to turn it off. To see everything that's moving, +EV or not, sort the 24h pts column instead.
How to use it:
- Steam plus a +EV price still on the board is the sweet spot — the market is moving toward this bet and at least one book hasn't caught up yet. These don't tend to last.
- Steam against your side (a negative number on the bet you like) means the market disagrees with you. Worth a second look before you bet.
- Short windows (2h) close to game time often mean news — a lineup, an injury, a scratch. Check the player's news before you act on it.
- If it has already steamed and the EV% is gone, you're late. The movement tells you what happened; the EV% tells you whether there's still a bet.
- Pair it with Sparklines. The Movement columns tell you how much the market moved; the sparkline shows you which books moved and when.
On mobile: tap 📈 Movement in the controls. Each card shows a small 24h chip with the 24-hour move, and the expanded card has a Movement section with every window.
Some boards (such as soccer and college football) show only the longer windows (plus Open). Those boards refresh games further out less often, so a short window wouldn't have enough snapshots to be meaningful.
The numbers update with the odds.
Liquidity: How Much Can You Actually Bet?#
Exchanges like Kalshi, Novig and ProphetX tell us how much money can be bet at each price they show. Sportsbooks like FanDuel, DraftKings and Pinnacle don't. We show that number, so you can tell a real price from a token one.
The small grey $ under a price is how much you can bet at that exact price right now. For example:
- +450 / $4 on Kalshi: you can only get about $4 on at +450. Anything more and the price gets worse.
- +450 / $500 on Novig: there's $500 waiting at +450.
It also shows next to the Best Book badge when the best price is an exchange, so you can see at a glance whether the best price on the board is one you could actually bet.
What the $ is (and isn't):
- It's the money waiting at that price, not how much has been traded on the line.
- It changes constantly as people bet and post new prices. It updates with the odds.
- No $ shown means that venue didn't report a size. It does not mean $0.
- "<$1" means there's almost nothing at that price.
- Sportsbooks never show a $. They don't publish limits, so their prices are always treated as available.
It is not a "sharp money" signal. Before building this, we tested whether the money sitting on exchanges points to value, several different ways. It doesn't: lines where a sportsbook beat a well-funded exchange price still lost to the closing line on average, and more money behind the exchange price didn't help. So use the $ to answer one question, "can I actually get this price, and how much?", not as a reason to bet.
The 💧 Liquidity columns#
Click 💧 Liquidity in the toolbar (next to Movement) to open two columns:
| Column | What it shows |
|---|---|
| Exchange price | The best exchange price for this side, and which exchange |
| $ you can bet there | How much you can bet at that exchange price right now |
Both sort like any other column. Click $ you can bet there to see the lines with the most money available first. The 🔒 lock keeps the columns on across visits, same as Movement and Player Info.
The 💵 Exchange $ button#
Pick an amount you want to bet, then tick whichever of these you want. Everything is off until you tick a box, so the board looks exactly the same unless you change it.
- Only count exchange prices with at least $X. Best Book, Best Odds, EV and the stakes use the best price where your amount can actually be bet. An exchange price with less than that behind it is skipped, and the next-best price is used. Sportsbooks always count. If no price on a line can take your amount, the line drops off the board. This one is remembered on your device.
- Example: a 2+ goals line shows Novig +6567 as the best price, but only $7 is available there. With this box on at $500, the best price becomes FanDuel +6500, the one you could really bet.
- Hide lines with less than $X on the exchange. Hides exchange-quoted lines where less than your amount can be bet. Lines no exchange quotes stay.
- Hide lines no exchange quotes. Shows only lines at least one exchange is pricing.
The two "hide" boxes clear when you hit 🧹 Clear. The amount and the "only count" box stay.
On mobile: tap 💧 Liquidity and 💵 Exchange $ in the controls. The expanded card has a Liquidity section, and you can sort by $ you can bet on the exchange.
Which boards have it: every board where exchanges post prices. Where no exchange prices a market, there's nothing to show.
Player Tooltips and Player Details Panel#
Beyond just seeing the bet details, the Value Finder gives you quick access to player-specific projections and historical performance data from your sport's Projections tab. This helps you add context to the mathematical edge shown in the table.
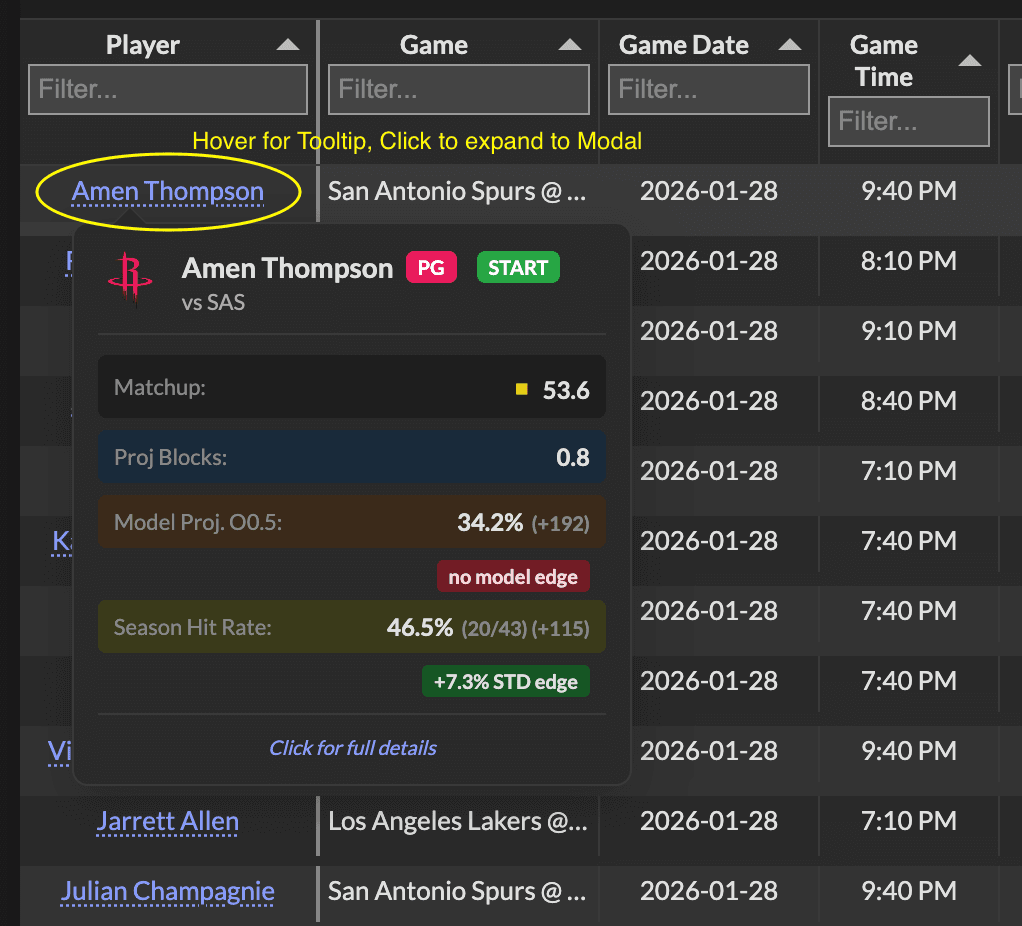
Quick Player Tooltips#
On Desktop: Hover over any player name to see a quick tooltip with key information.
On Mobile: Tap the player name to open a popup with the same information.
The tooltip shows:
Player Context
-
Team, position, and opponent
-
For NBA: Overall matchup score and Defense vs Position (DvP) rating for the specific stat
-
For NHL: Line assignment (1st line, 2nd line, etc.) and power play unit, plus matchup boost factor
Model Projection
-
Our projected probability for hitting this specific line
-
Shown as both a percentage and American odds
-
Edge indicator: Compares model projection to current best book odds
-
Green badge shows "+X.X% model edge" when the book odds are better than our projection suggests
-
Red badge shows "no model edge" when the book odds don't offer value vs our model
-
🔥 Fire emoji appears for the biggest edges
-
Season-to-Date (STD) Hit Rate
-
Historical hit rate for this player at this specific line
-
Shows games hit out of total games played (e.g., "12/18")
-
Converted to implied odds for easy comparison
-
Edge indicator: Compares historical hit rate to current best book odds
-
Green badge shows "+X.X% STD edge" when book odds are better than history suggests
-
Red badge shows "no STD edge" when the book odds don't offer value vs historical performance
-
🔥 Fire emoji for the biggest edges
-
Understanding the Edge Indicators#
The edge indicators help you quickly see whether the current odds represent value compared to two different benchmarks:
Model Edge tells you: "Based on our projection model, is this bet +EV at the current odds?"
STD Edge tells you: "Based on how often this player has historically hit this line, is this bet +EV at the current odds?"
When both show positive edge, that's a strong signal - the model AND history agree there's value. When they disagree, use your judgment about which you trust more for that specific situation.
Important: These edge calculations are independent of the Fair Value shown in the main table. Fair Value is based on sharp book consensus (market-derived). The tooltip edges are based on our proprietary projections and historical data. They're complementary views, not duplicates.
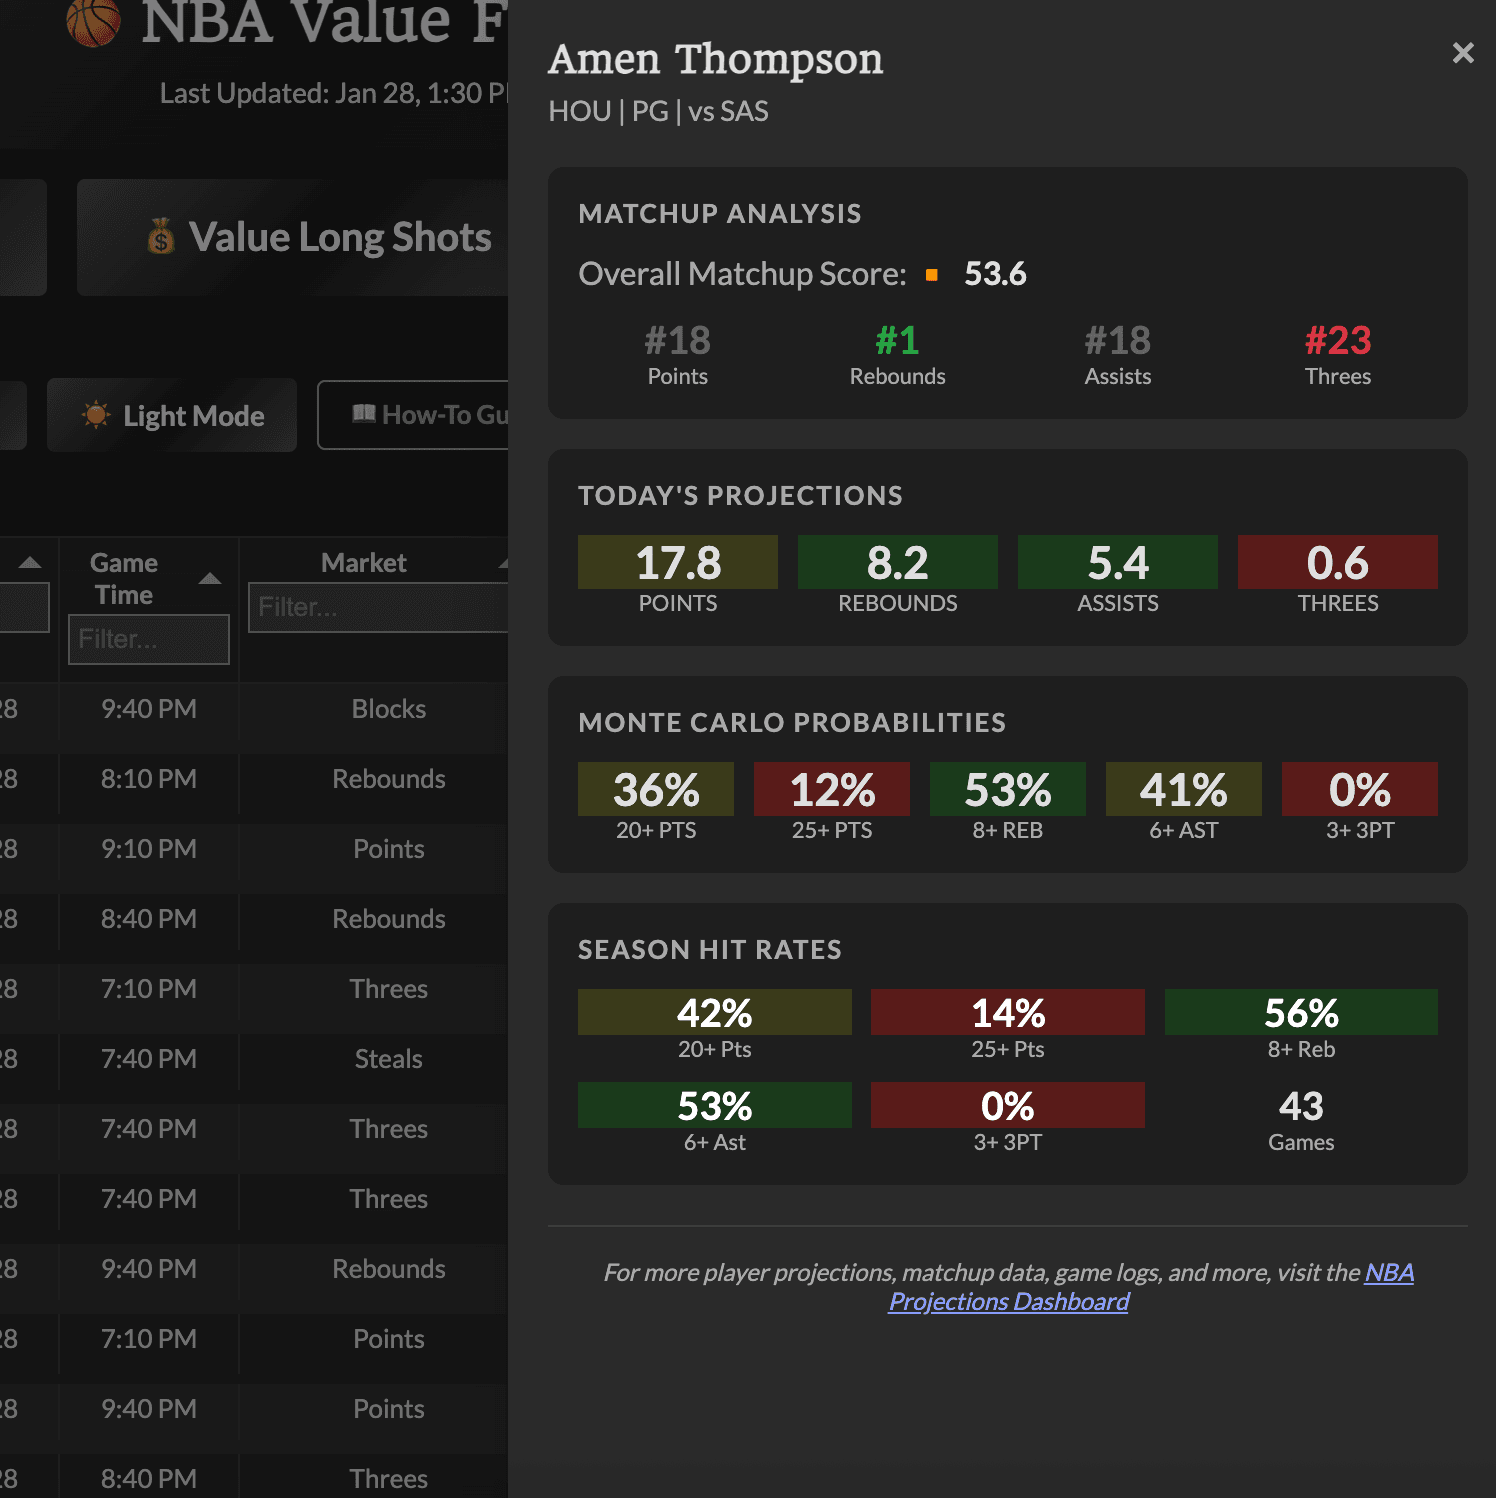
Full Player Details Panel#
Want even more detail? Click the player name (desktop) or tap "View Full Player Details" in the mobile tooltip to open the full Player Details Panel.
The panel includes everything from the tooltip plus:
Detailed Projections
-
Full stat projections across all categories (points, rebounds, assists, threes for NBA; goals, shots, points for NHL)
-
Color-coded by projection strength
Monte Carlo Probabilities
-
Model-generated probabilities for common thresholds (20+ points, 25+ points, 8+ rebounds, etc.)
-
Helps you evaluate alternate lines beyond what's shown in the main table
Complete Hit Rate History
-
Season hit rates for multiple threshold levels
-
See patterns like "hits 20+ points 75% of the time but only hits 25+ points 40% of the time"
DvP Breakdown (NBA)
-
Defense vs Position rankings for each stat category
-
See if the matchup favors scoring, rebounding, assists, or threes
How to Use Player Data in Your Process#
The player tooltips and panel are contextual tools, not primary decision drivers. Here's how to use them effectively:
-
Start with the value math - The main table columns (EV%, Conf. Adj. Recc. U, Fair Odds) should drive your decisions
-
Use tooltips for quick validation - A quick hover can confirm whether model and history support the opportunity
-
Dig deeper when uncertain - If you're on the fence about a bet, the full panel gives you more data points
-
Don't override good math with bad gut feelings - If the numbers say it's +EV but you "don't like" the player, the numbers are probably right
Line Tooltip: Available Lines#
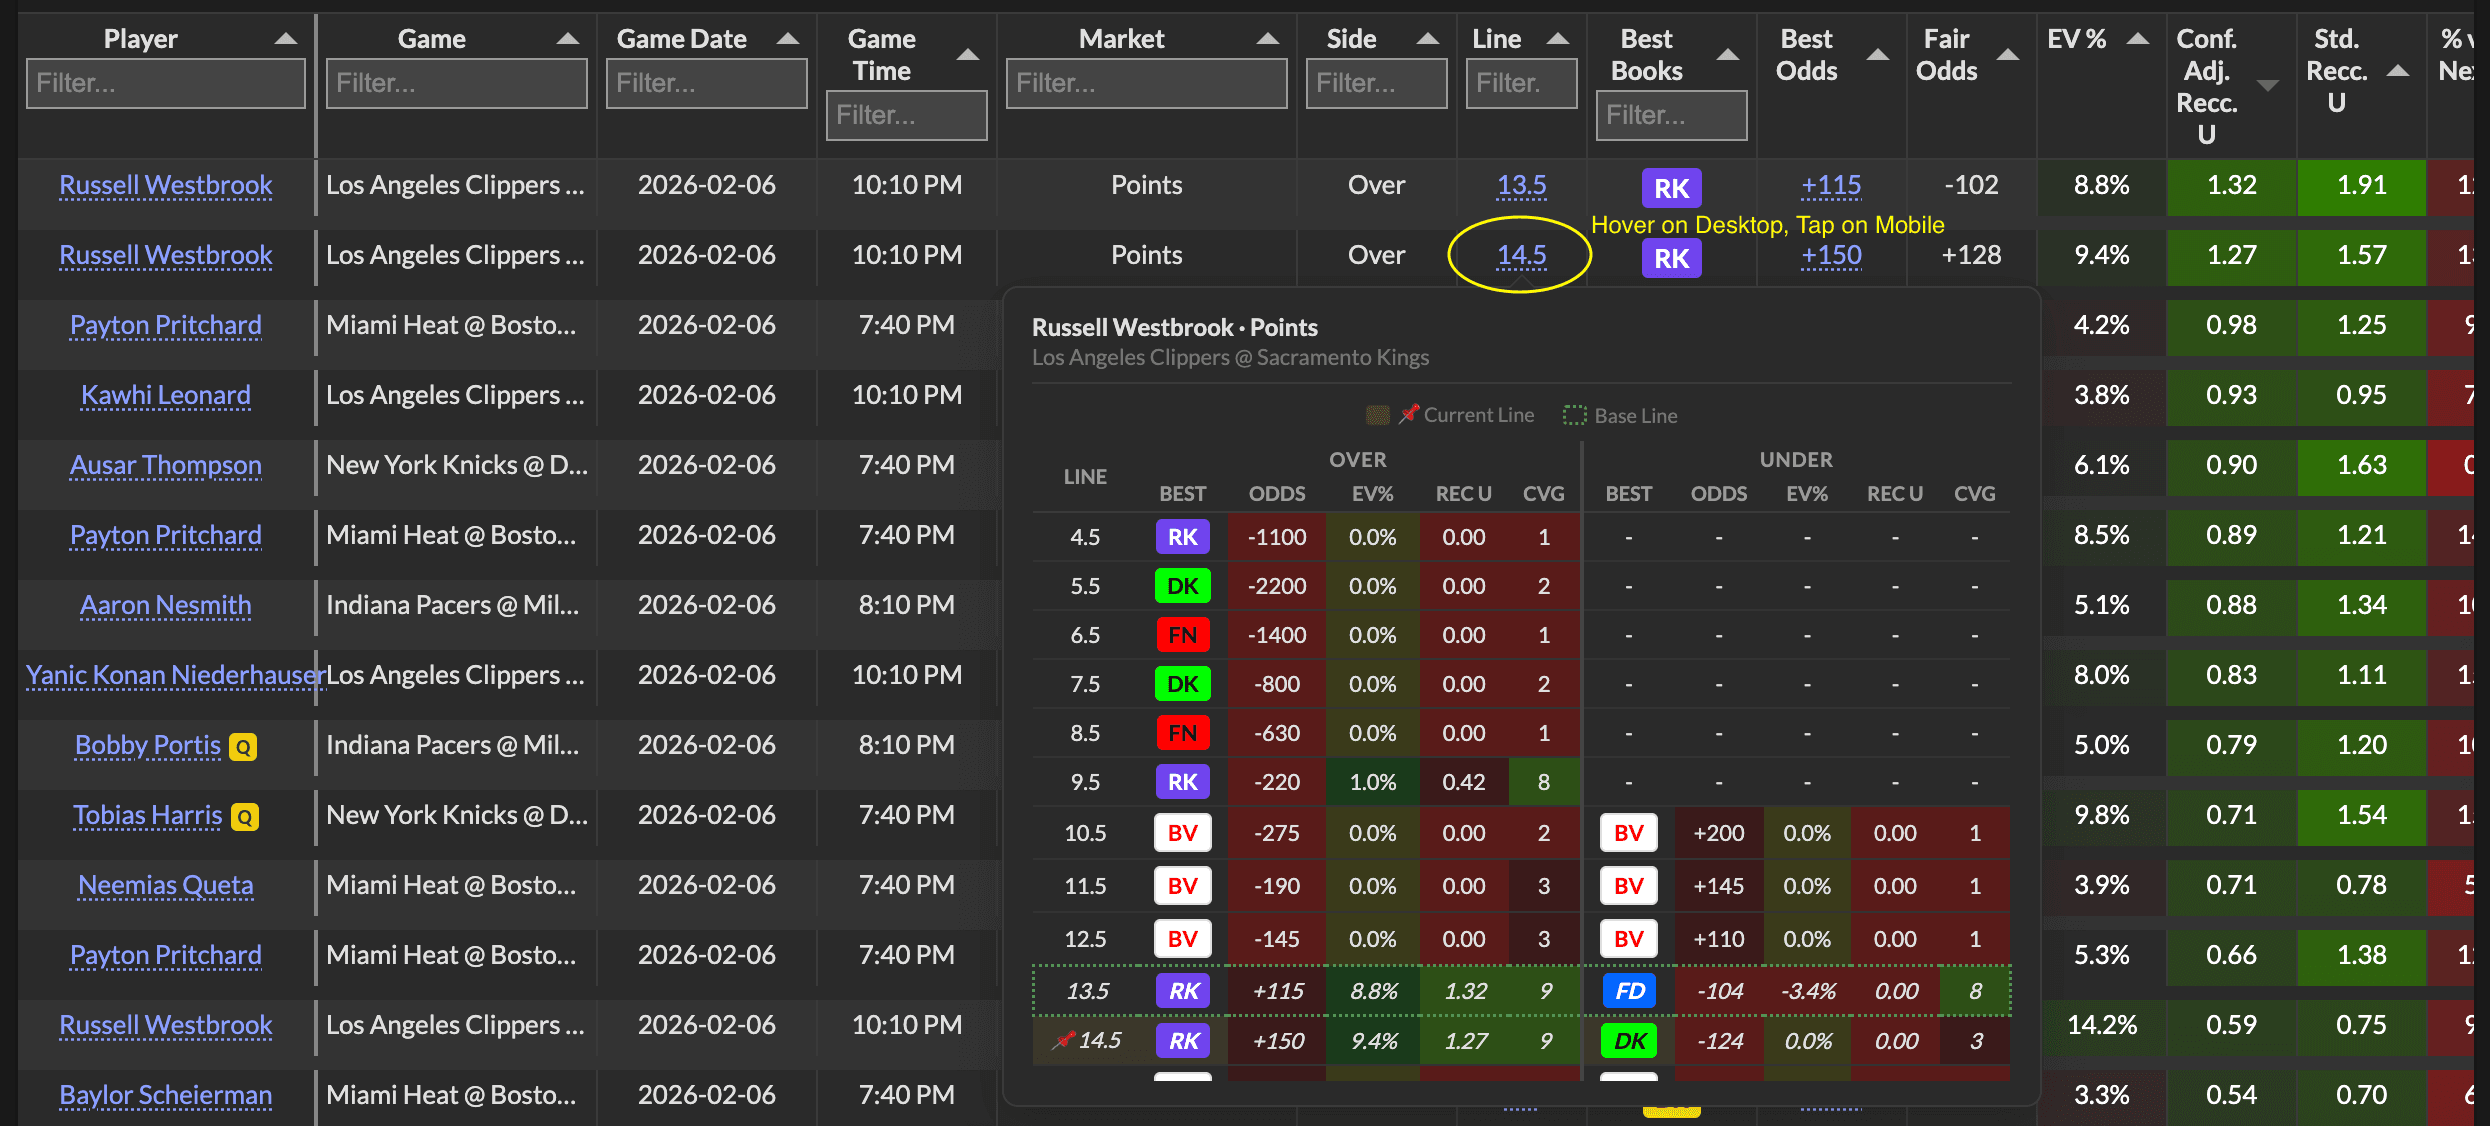
Ever wonder what other lines are available for a player prop you're looking at? The Line Tooltip lets you see all available lines for that player/market in one place, so you can compare and decide if the line you're viewing is the best one to bet.
How to Open the Line Tooltip#
On Desktop: Hover over any value in the Line column (shown with a dotted underline). A tooltip will appear below the cell.
On Mobile: Tap any Line value to open a full-screen popup with the same information.
What the Line Tooltip Shows#
The tooltip shows a side-by-side table with Over and Under columns for every available line. For each line and side, you'll see:
-
Best - The book offering the best odds for that line/side
-
Odds - The best available American odds
-
EV% - Expected value percentage at those odds
-
Rec U - Confidence-adjusted recommended units
-
Cvg - How many books are offering that line
All data columns are heatmapped (green = higher, red = lower) so you can quickly spot where the value is. The heatmapping on Odds is anchored at -100/+100 (even money) and EV% is anchored at 0%, so the colors are always meaningful regardless of what lines are available.
Current Line vs Base Line#
Two indicators help you orient yourself in the table:
-
📌 Current Line - A pin emoji and yellow highlight marks the line and side you hovered/tapped from. This is your "you are here" marker.
-
Base Line - A dotted green outline marks the most standard line for that market — the one with the most book coverage and the most balanced Over/Under odds. This represents where the market is centered.
Comparing your current line to the base line helps you understand whether you're looking at the primary market line or an alternate. Sometimes alternate lines offer better value — the tooltip helps you see that at a glance.
Using the Line Tooltip#
-
Compare lines - If you see a line with higher EV% or Recc. U than the one you're currently viewing, consider betting that line instead
-
Check both sides - The side-by-side layout lets you instantly see if the Over or Under has more value at each line
-
Look at coverage - Lines with higher coverage (Cvg) have more reliable fair value calculations
-
Find the base line - The dotted green outline shows you where the market is centered, which is useful context for understanding alternate lines
Desktop vs Mobile#
The Value Finder works on both desktop and mobile, but the experience is a bit different. Here's what to expect on each.
Desktop View#
On desktop, you see the full table with all columns visible. You can:
-
Scroll horizontally to see all columns (individual book odds are on the right)
-
Click column headers to sort
-
Type in the filter row below headers to filter
-
Use pre-made filter buttons at the top
This is the power-user view. You have everything at your fingertips and can quickly compare opportunities.
Mobile View#
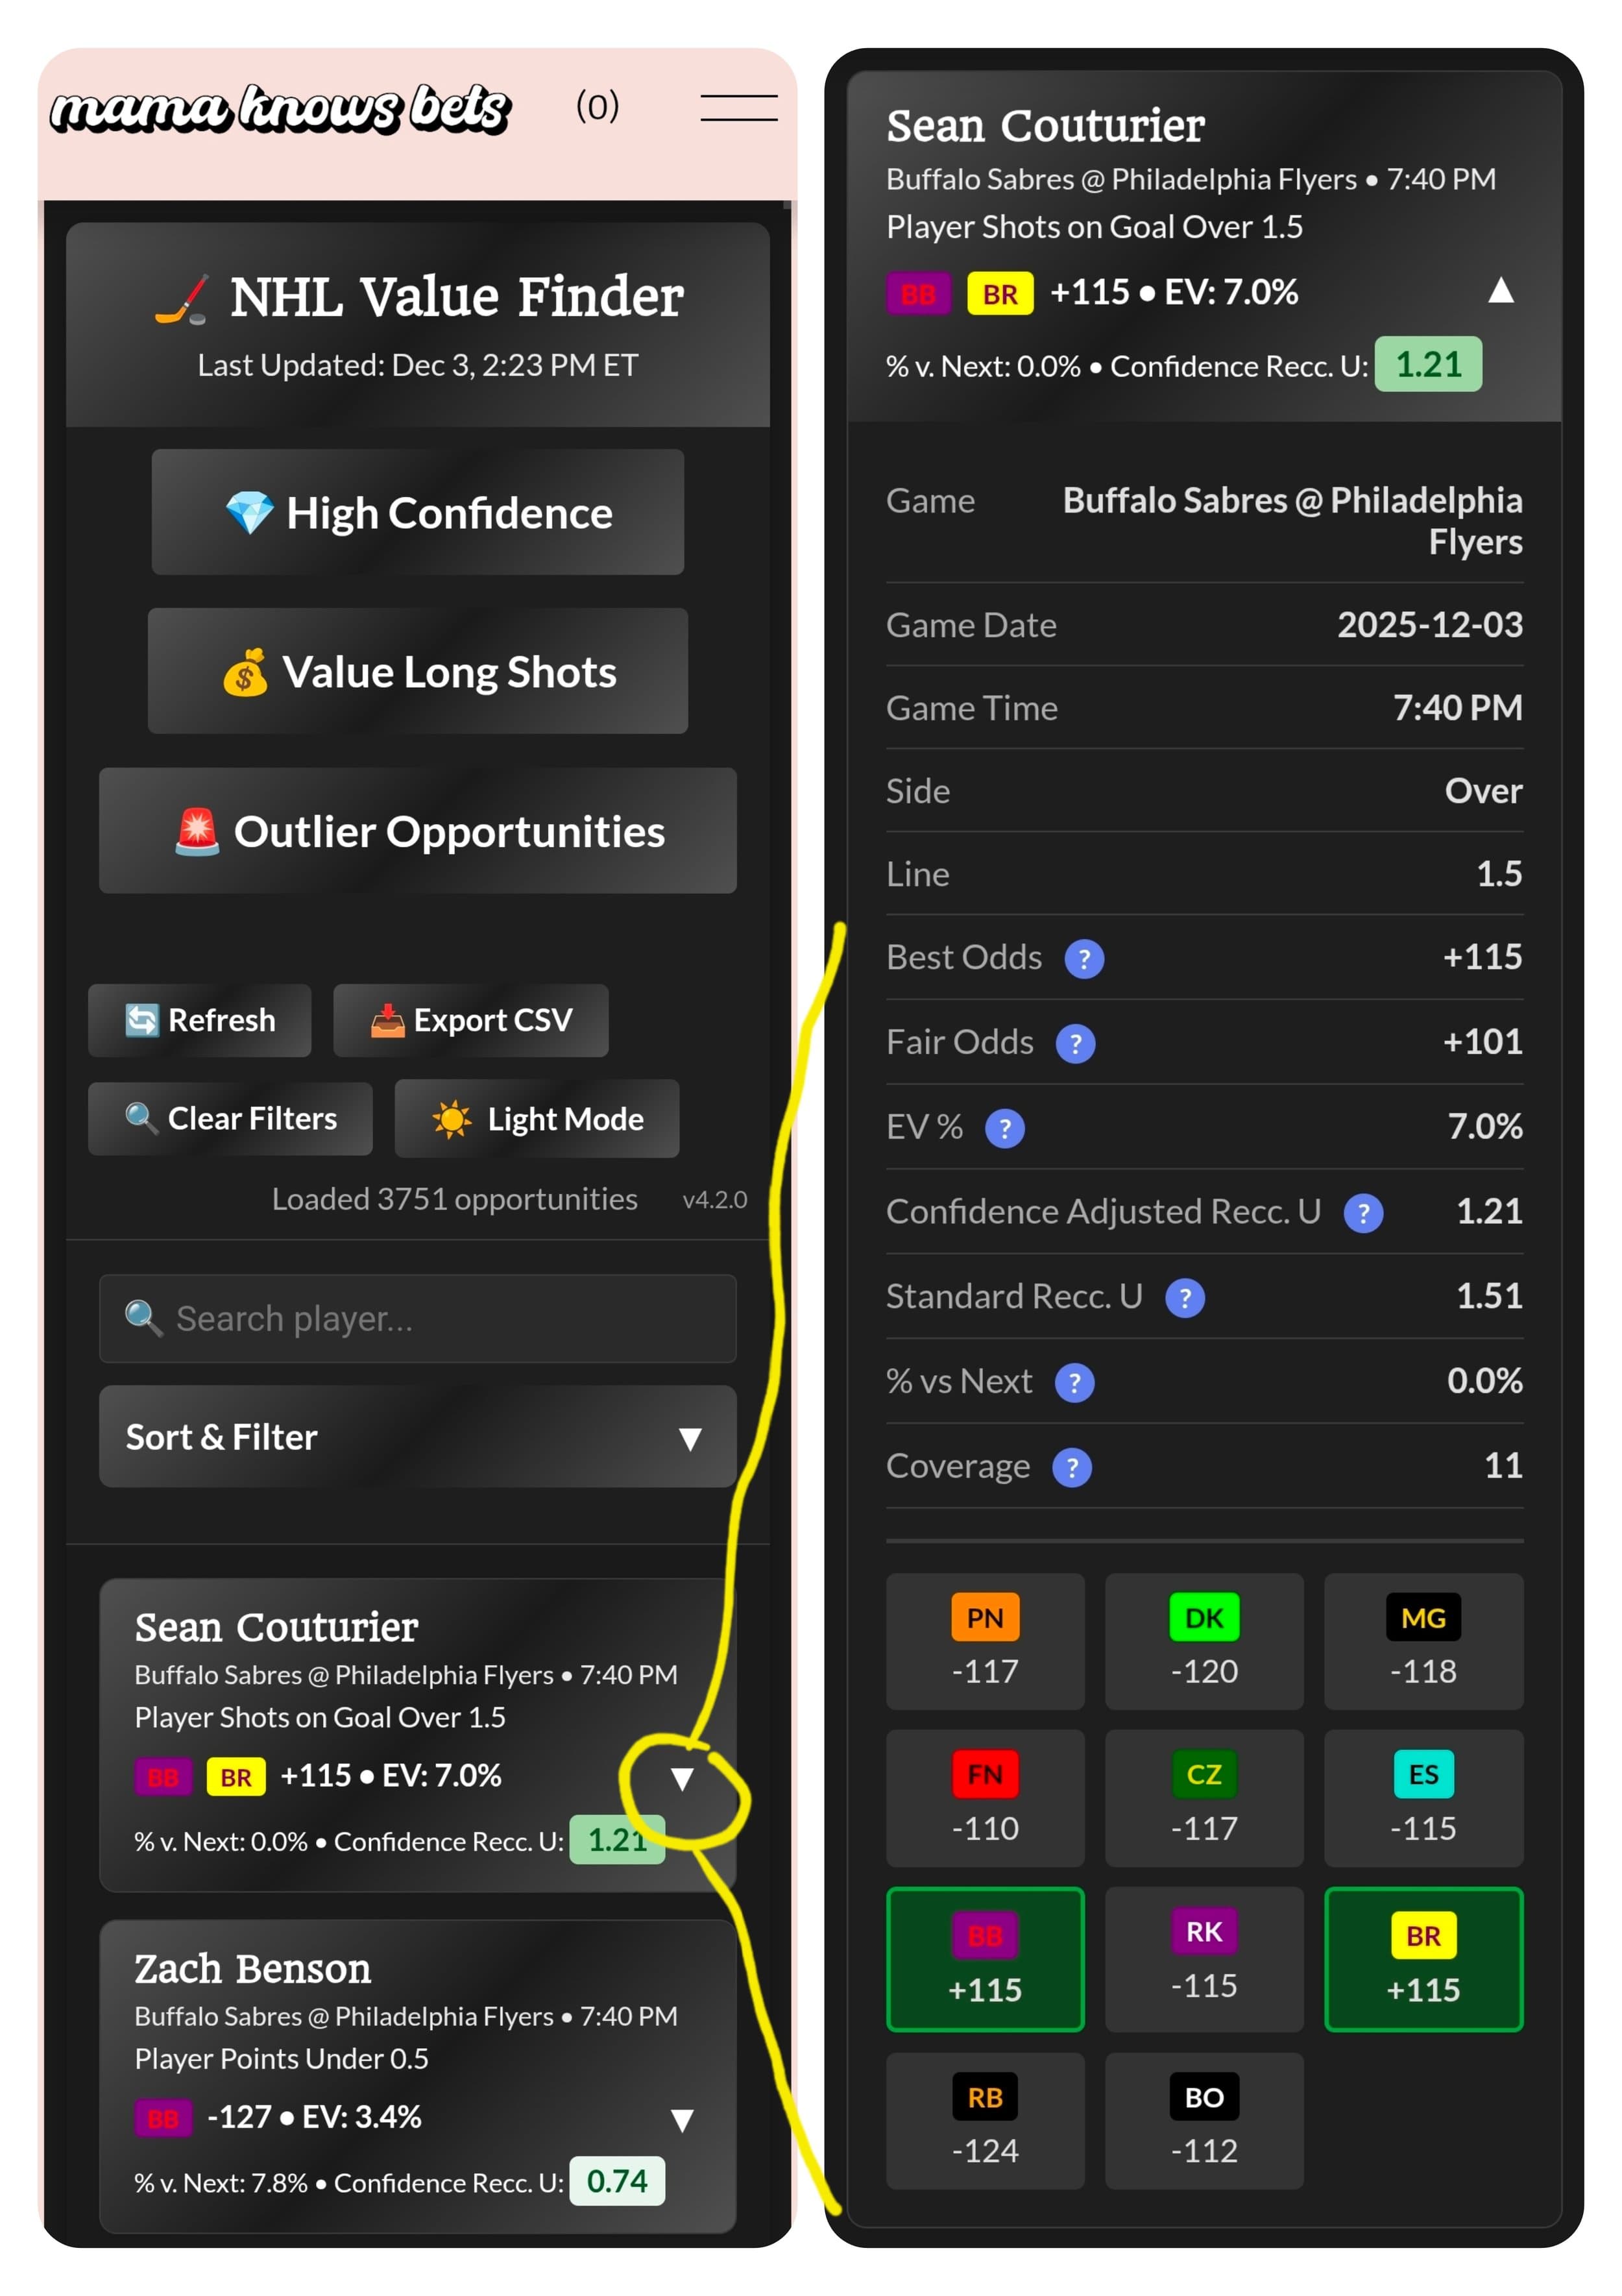
On mobile, the layout adapts to fit your screen. Key differences:
Card Layout: Instead of a table, each opportunity displays as a card with the key information stacked vertically. This makes it easier to read without horizontal scrolling.
Collapsed View: Each card shows the essentials at a glance:
-
Player name, game & game time
-
Market and line
-
Best Book and Best Odds
-
EV% and Conf. Adj. Recc. U
-
% vs. Next
Expand for Details: Tap the triangle/arrow on any card to expand it. The expanded view shows:
-
All individual book odds (PN, FD, DK, MG, etc.)
-
Additional details like Coverage, Fair Odds, Std. Recc. U
-
Everything you'd see in the desktop table view
This keeps the mobile view clean while still giving you access to all the data when you need it.
Search Bar: At the top, there's a search bar to quickly find a player by name.
Filter Dropdowns: Tap the "Filters" toggle to expand filter options. You'll see dropdown menus for:
-
Sort By (Conf. Adj. Recc. U, % vs. Next, Best Book Odds, etc.)
-
Filter by Market
-
Filter by Best Book
-
Filter by Game/Tournament
You can check multiple options in each filter (multi-select), just like on desktop.
Tips for Mobile Users#
-
Use the search bar - Fastest way to find a specific player
-
Sort first, then filter - Get opportunities ordered by value, then narrow down
-
Bookmark the page - Add it to your home screen for quick access
-
Cross-reference with the book's app - Have your sportsbook app open to quickly check if the odds are still available
When to Use Which#
-
Desktop: Best for deep analysis, comparing multiple opportunities, checking individual book columns
-
Mobile: Best for quick checks, placing bets on the go, monitoring opportunities throughout the day
Both give you the same data - just presented differently for the screen size.
Executing Bets from the Value Finder#
This section is critical. The opportunities you see are +EV at the odds shown, at the book shown, at the time shown. For more on this topic, read Why Taking the Best Odds Matters.
Scenario 1: The odds are still available#
You see an opportunity: Player X Over 0.5 Goals at +360 on DraftKings, 1u recommendation. Fair odds are +300 (25% implied probability).
You check DraftKings - It's still +360. Take the bet exactly as shown.
Scenario 2: The odds have moved against you slightly#
Same opportunity, but now DraftKings shows +340 instead of +360.
The EV is lower. The correct play is to recalculate your stake. A +340 line has less edge than +360, so you should bet less - 0.75u instead of 1u. Use an odds/Kelly calculator to determine the exact proper new stake.
If you don't want to do the math, a simple rule: reduce your stake by roughly the same percentage the odds dropped.
Scenario 3: The odds have moved significantly#
The Value Finder showed +360, but now it's +280. At Fair Odds of +300, this is now BELOW fair odds.
Don't take the bet. The edge is gone. You're in -EV territory now. Move on to the next opportunity.
Scenario 4: You can only get it at a different book#
The Value Finder shows +360 on DraftKings, but you don't have a DraftKings account. Your best option is +320 on FanDuel.
This could be a trap. You found the opportunity, you want to bet it, but +320 might be -EV even though +360 was +EV.
Make sure it's still +EV at your odds. If the fair value is +300 and you're getting +320, you still have a small edge - recalculate your stake and you can still take the bet. BUT, if the fair value was +340 and you're getting +320, you're now -EV. Pass on it.
+EV Betting Basics#
If you're new to +EV betting, here's what you need to know.
What is +EV?#
Expected Value (EV) is the average profit or loss you'd expect from a bet over many repetitions.
-
+EV (Positive EV): Long-term profitable. The odds are in your favor.
-
-EV (Negative EV): Long-term losing. The house edge is against you.
Why +EV Works#
Sportsbooks set lines to balance their action and build in profit margin (vig). But they're not perfect. Sometimes a book offers odds that are actually better than the true probability - that's +EV.
Over hundreds of bets, +EV compounds. Individual bets will win and lose, but mathematically, you'll come out ahead.
Read even MORE in What is +EV Betting?
The Kelly Criterion#
The Conf. Adj. Recc. U and Std. Recc. U columns use the Kelly Criterion - a formula that calculates optimal bet sizing based on your edge and the odds.
Kelly protects you from:
-
Overbetting when your edge is small
-
Underbetting when your edge is large
-
Going broke from variance
We use Quarter Kelly (Kelly × 25 where 1 unit = 1% of bankroll) for more conservative sizing.
For more about setting and managing your bankroll to determine what your unit should be and therefore how much to wager per bet, please read Bankroll Basics!
Variance is Real#
Even with +EV bets, you'll have losing streaks. That's normal. The math plays out over hundreds and thousands of bets, not dozens.
Trust the process. Stick to the sizing recommendations. Don't chase losses.
How the Value Finder Calculates Fair Value#
This section gets into the methodology behind the numbers. Understanding how Fair Value is calculated helps you interpret opportunities more intelligently and builds confidence in the process.
The Core Concept: De-vigging#
Every sportsbook builds profit margin (vig or juice) into their odds. When you see -110 on both sides of a bet, the book is taking about 4.5% off the top. That vig needs to be stripped out to find the "true" probability.
De-vigging is the process of removing the sportsbook's margin to reveal fair odds.
Example:
-
A book offers Over 24.5 points at -115 and Under 24.5 at -105
-
The implied probabilities are 53.5% and 51.2% - totaling 104.7%
-
That extra 4.7% is the vig
-
De-vigging normalizes these to sum to 100%: ~51.1% Over, ~48.9% Under
-
Fair odds would be approximately -105 Over, +105 Under
How We De-vig: The Method Matters#
We use individual book de-vigging - each book's odds are de-vigged independently, then combined into a weighted consensus. This is important because:
-
Prevents double-counting vig - If we averaged odds first, then de-vigged, we'd get distorted results
-
Preserves book-specific pricing signals - Each book's de-vigged probability reflects their true market view
-
Allows proper weighting - We can weight sharper books more heavily after de-vigging
For two-way markets (Over/Under), we use proportional de-vigging - both sides are normalized to sum to 100%.
For one-way markets (like Anytime Goal Scorer where we only see one side), we use a sliding vig scale where we remove less vig from shorter odds and more from longer odds. The sliding scale reflects reality - books typically charge more vig on longshots.
Book Weights: Not All Books Are Created Equal#
Here's where it gets interesting: we don't weight all books equally when calculating Fair Value.
Some books are "sharper" than others. Sharp books:
-
Take large bets from professional bettors
-
Adjust their lines quickly based on betting action
-
Have more accurate lines because they'd get crushed otherwise
Retail books (the ones you can actually bet at easily) sometimes have "soft" lines that lag behind the sharp market. When a retail book is offering significantly better odds than the sharp consensus, that's often a +EV opportunity.
How Book Weights Work#
-
Each book gets a weight based on how "sharp" we believe their pricing is
-
When calculating Fair Value, sharper books influence the number more heavily
-
If a book isn't offering odds on a market, their weight is redistributed to the books that are
Example: Say a sharp Book A shows 30% probability and a softer Book B shows 35% probability:
-
The weighted fair value will lean closer to 30% because the sharper Book A carries more weight
-
If Book B is offering odds that imply 35% but fair value is 30%, that's +EV at Book B
Market-Specific Book Weights#
A book might be sharp in one market and soft in another. For example:
-
A book could be excellent at pricing Points props but poor at Rebounds
-
Another might nail Three-Pointers but struggle with combo markets like PRA
That's why we use market-specific weights - the same book can have different influence depending on which prop type you're looking at.
The Coverage Factor#
Fair Value is only as good as the data behind it. When more books are reporting odds:
-
We have more data points to triangulate
-
The consensus is more reliable
-
We're more confident in the Fair Value calculation
When only a few books are reporting:
-
Fair Value might be less accurate
-
One book's error has outsized influence
-
We reduce confidence (which is why Conf. Adj. Recc. U scales down)
This is why the Coverage column matters. Higher coverage = more confident Fair Value.
How Results Refine the Book Weights#
Here's something important: we don't just set book weights and forget them. We use actual profitability results to continuously refine our methodology.
The Profitability Suite tracks every opportunity that appears on the Value Finder. When games finish, we calculate whether bets hit or missed and compute P/L. Over time, patterns emerge:
Sharp books get MORE weight if:
-
We're losing when they have the best odds (their lines are more accurate than we thought)
-
Their pricing consistently predicts outcomes better than the consensus
Soft books get LESS weight (or stay the same)
-
We're winning when they have the best odds (their lines are exploitable)
-
They're consistently mispricing relative to the market
The feedback loop:
-
Book weights determine Fair Value →
-
Fair Value identifies +EV opportunities →
-
Results show which opportunities actually profit →
-
Results inform weight adjustments →
-
Repeat
This is why results analysis matters. A book showing strong positive ROI means their lines are soft - we're profiting by fading their prices. A book showing negative ROI means their lines are sharper than we credited - we should weight them more heavily in Fair Value.
We only make weight adjustments when:
-
Sample size is sufficient (enough bets on that book/market combo to be meaningful)
-
The pattern is consistent, not just a hot or cold streak
-
The signal is statistically meaningful, not noise
Why This Matters for You#
Understanding the methodology helps you:
-
Interpret Coverage correctly - Low coverage doesn't mean "bad bet," it means "less confident Fair Value." Size accordingly.
-
Understand why Conf. Adj. Recc. U varies - It's not arbitrary. It reflects how confident we are in the underlying calculation.
-
Trust the process - The system is self-correcting. When patterns emerge in results, weights adjust to capture them.
-
Apply your own judgment - If you see an opportunity but only one unfamiliar book is offering the odds, that's context. The Value Finder shows you the math; you decide whether to act.
-
Know this is one approach - Sharp book consensus is a proven methodology, but it's not the only valid approach. Some successful bettors build their own models, some use other tools. The Value Finders give you one well-reasoned framework.
Finding Your "Special Sauce"#
Here's the most important thing I can tell you:
There is no one right way to use the Value Finder. Everyone develops their own special sauce.
The Conf. Adj. Recc. U is the gold standard to point you in the right direction. After that, you can layer on your own criteria:
Ways to Further Filter Opportunities#
-
Focus on one book: Filter to only see opportunities at books you have
-
Focus on one market: Become an expert in goal scorers, or points, or TDs
-
Compare to Pinnacle: Look for large spreads between your book and the sharpest book
-
High coverage only: Only take bets where most books are reporting
-
Time-based: Focus on games starting soon, or get an early jump on lines for tomorrow’s games
-
Player matchups: Use the Value Finder to identify candidates, then apply your own matchup analysis
Combining Value + Data#
Some people use the Value Finder purely on the math for value. Others combine it with their own research on players.
My personal opinion: +EV > data, because books have access to all the same data we do - it's already baked into their lines.
But it can be fun and reassuring to review player stats, look at matchups, and make your own assessment. If you have several +EV plays you're deciding between, your own analysis can help narrow it down.
The Learning Curve#
You'll learn as you go. You start to notice patterns:
-
What markets move fastest
-
Which books consistently have outlier odds
-
What coverage level feels reliable
-
What works best for YOU
Keep experimenting and exploring to find a style that fits you.
Mama’s Personal Process (Example)#
Here's how I personally use the Value Finders - not as a prescription, but as one example of a "special sauce":
-
Sort (high to low) and/or Filter by Conf. Adj. Recc. U - this is always my starting point, and I focus on props with >0.25 Conf. Adj. Recc. U, however for super long shot props (+2500 and up) ~0.10u is acceptable to me as those will naturally have lower recommendations
-
Filter by book for whichever book(s) I'm placing bets on
-
Focus on my odds/props - I prefer longer odds props (+500 and up) like Anytime Goalscorer, First Basket, Home Runs, etc, for most of my plays
-
Look for high coverage - I prefer 7+ books reporting
-
Check width to sharp books - I look for large spreads between my book and books I consider sharp, like Pinnacle or FanDuel depending on the market
-
If deciding between similar plays in the same game, I'll look at other data indicators to pick one
-
Execute at the shown odds or recalculate if odds have moved
That's my process. Yours might be completely different - and that's great! The Value Finder gives you the foundation; you build on top of it.
Quick Reference#
Column Priority (What Matters Most)#
-
Conf. Adj. Recc. U - Your primary sorting metric
-
Best Book / Best Odds - Where to place the bet
-
Fair Odds - For verifying EV if odds change
-
Coverage - Confidence in the calculation
-
% vs Next - How much of an outlier the Best Book is compared to the next closest book
When to Take a Bet#
✅ Odds match or are better than shown
✅ You've recalculated for slightly worse odds
✅ Still +EV at your available odds
When to Skip#
❌ Odds have moved significantly against you
❌ Only available at -EV odds
❌ Low coverage and you're uncertain about Fair Value
Best Practices#
A few habits that will help you get the most out of the Value Finders:
Hard Refresh Regularly#
Do a hard refresh (Cmd+Shift+R on Mac, Ctrl+Shift+R on Windows) every so often to make sure you're running the latest version of the Value Finder. I push updates and improvements regularly, and a cached version might not have the latest features or bug fixes.
Good times to hard refresh:
-
First thing when you open the Value Finder for the day
-
If something looks off or isn't working as expected
-
After I announce an update in Discord
Check Odds Before Betting#
The Value Finder shows you a snapshot in time. Odds move constantly. Always verify the odds are still available at your book before placing a bet. If they've moved, recalculate whether it's still worth taking.
Give It the Eyeball Test#
Always use discretion and scan the individual book columns before taking a bet. The Value Finder calculates fair value based on all the odds it sees - but sometimes those odds include pricing errors or glitches.
Here's a real example of what can go wrong:
A player's anytime goal scorer odds were showing +575 at most books. But FanDuel briefly glitched and showed +180 for the same player. The Value Finder saw that +180 and factored it into the fair value calculation, making the +575 look like an incredible edge - a "hammer" opportunity.
Then FanDuel corrected back to +575 like everyone else. The fair value adjusted, and suddenly that "hammer" was just a normal line with no special edge.
How to protect yourself:
-
Scan all the book columns - Do the odds look roughly consistent? Or is one book wildly different from everyone else?
-
If one book is a huge outlier, ask why - Is it a legitimate mispricing you can exploit? Or does it look like an error that will correct?
-
Be especially skeptical of outliers that pull fair value in their direction - If the "edge" only exists because of one weird line, it might not be real.
-
When in doubt, wait - Refresh the Value Finder in a few minutes. If it was a glitch, it'll correct. If it was real value, you might still catch it.
The Value Finder is a tool, not an oracle. It shows you the math based on available data - but you need to apply judgment about whether that data makes sense.
And if you miss something and realize later you took bait on a glitchy line? Don't beat yourself up. It happens to everyone. Learn from it, move on, and keep churning.
Don't Chase Every Opportunity#
You don't need to bet everything that shows up. Focus on the opportunities that fit your criteria - your books, your preferred markets, your comfort level with coverage. Quality over quantity.
Keep Your Own Records#
Track your bets, what odds you actually got, and your results. This helps you understand your own patterns and see how the math is playing out over time. A dedicated bet tracking app is great for this.
Remember:
The Value Finder is a tool. How you use it is up to you. Experiment, track your results, and find what works for your style.
Good luck, and remember: the math is on your side. Trust the process!
To see how Value Finder picks have performed, head to the Profitability Suite guide.
⚠️ The Value Finders are for entertainment purposes only and are not financial advice. This is gambling, and nothing is guaranteed. Wager at your own risk & discretion. ⚠️
Finding value matters.
Unlock our full suite of tools and join a community of sharp bettors.
- All Value Finders
- Projection models & sims
- Full Discord access
- MLB, NFL, NBA, NHL, WNBA, NCAAF, Golf & Soccer
- Data export
$35/month — 14-day money-back guarantee
Join MKB VIP