
Mama Knows Bets NHL Value Model: How-To Guide

Intro
Ultimately, it's up to you personally to decide what matters to you within my model, and all my followers use it slightly differently! The below info will help you understand what each column is, so that you can make your own judgment call on how much you want to to weight or consider that piece of info as you research for your bets. You may choose to completely ignore certain columns, or only focus on one column. That is your choice! There is no black or white, right or wrong answer on how you consider data. That's what makes it so fun and interesting! (to me at least 🤓)
For those that ask about how I personally select my bets: I'm picking players who are best odds, or at least over Fair Value, on books that I have (I don't have BetRivers or Bet365), and then either have a very high QK (which is the recommended units you would put on each play and also therefore an indicator of value; more below) or look really good based on the data indicators to the right -- as a note Yellow Stars or Green Circles are best for ALL columns, so I basically just want to see as much yellow and green as possible. I prioritize the "Player Line Advantage" column as I've found that correlates the MOST with scoring (orange squares are also good here, I just typically avoid the red Xs).
Lastly, regarding the resources I link below: Google, ChatGPT and/or Grok are also AMAZING resources for learning more. I highly recommend throwing in a search term and seeing what you get. My linked resources below, and my models in general, are not the end-all be-all of data - research for yourself! You can do it! You don't need to rely on anyone else for great data, you can always find it yourself and I highly encourage you to try. 💪🏻📝📚🤓
I hope this post will help you research and make your most informed wagers! As always, good luck. 🫶🏻
REMINDER the odds shown are “locked in” (static) as of the time the model is published - you should always re-check odds yourself on either the MKB Value Finder or another odds screen (like PickTheOdds, which is free!) before placing your bets to ensure you are still placing on the best book at the best available odds!
📝 TARGET LIST VS. TOP 6 BY GAME 📝

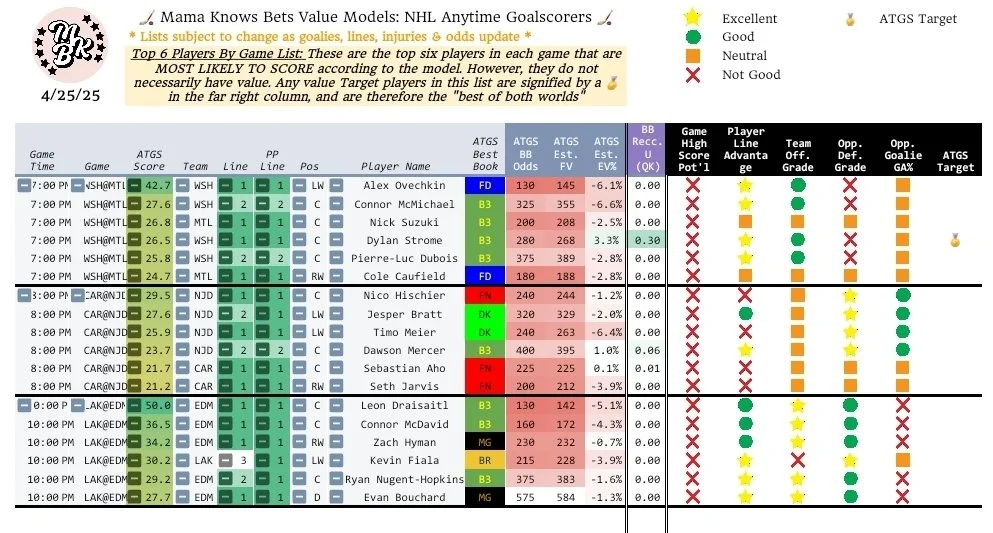
🏅 TARGET LIST: These are players who are meeting criteria for both DATA and VALUE, according to my model. My model is seeing an outsized chance for this player to score a goal, and my model is calculating value at the shown Best Book odds. While the target list can have negative days and even weeks, at both flat rate betting (e.g., 1 unit on each player or any other flat amount) as well as QK betting (bet each player at the recommended QK), this target list has been profitable over time, historically.
➡️➡️Note these players are ONLY recommended at their Best Book odds - NOT at any lower price!! Please ALWAYS USE BEST BOOK ODDS - this will help improve your likelihood for long-term profitability. Here’s more on why.
6️⃣TOP 6 BY GAME: The top 6 players most likely to score per game, according to my model's scoring formula (the MKB Score). These players have the highest likelihood of scoring (~30%+), but they're often heavily favored and juiced at the books which typically gives them less value for straight bets. Ideal for using promos or rounding out parlays. If anyone on the Top 6 List is also on the Target List, you will see the 🏅 in the far right column. This indicates they are the best of both worlds, as they are most likely to score within their game AND they have value at their best book odds.
📚 NHL GLOSSARY 📚
Description of columns shown in the model
➡️MKB (Mama Knows Bets) Score: This is my model's score for how likely this player is to acheive the outcome for this model - it is not a %, but higher scores are the more likely players to acheive the outcome. You can see "hit rate" for each score group range in the "results" shared daily with each model (always the last image).
➡️LINE: Which line the player is on - 1st line is usually the "best" players and they will play the most minutes. Note there are offensive and defensive lines, so each offensive line includes one each LW (Left Wing), C (Center), and RW (Right Wing). Defense lines contain 2 defensemen. There are 4 total offensive lines (12 total players) and 3 total defensive lines (6 players). Defensemen will play the most minutes but are less likely to score as they are playing further from the net.
➡️PP LINE: Which Power Play line the player is on - this is extremely valuable as this signifies the player gets to play when the team has a 5 on 4 man advantage (the other team takes a penalty). PP 1 is the first unit and will play the most power play minutes, PP 2 may come in as subs.
➡️Best Book: The book with the best odds for that player (should cover most books, but sometimes books are missing)
➡️Best Book Odds: Current odds on the best book (as odds change constantly, you should consider rechecking before placing your wager to make sure you are still getting best available odds - PickTheOdds is free and a great way to do this!)
➡️FV (Fair Value): My model's calculation of Fair Value based on odds across all books - my model uses a weighted average (i.e., sharper books are weighted heavier) across one-way lines and then on top of that removes an estimated vig (the "juice" added by sportsbooks) to get to what we believe the sportsbooks think is the true implied probability of this outcome. This is a more conservative method for one-way lines than using "market average" only, and my model is likely over-estimating the vig (intentionally). Note if lines are two-way (both an over and under are available), that is a more accurate way to calculate to Fair Value, but most books do not offer two-way lines of my targeted props. Also note that estimating Fair Value is NOT a black and white process and you may see other odds screens or services land at a different Fair Value than my model does - everyone calculates a bit differently. It is up to you to decide how you much you trust any given source of Fair Value. Do your own research too!
➡️EV (Expected Value): The estimated Expected Value of this bet at best book odds as a %. The higher the number, the more value this bet has at the best book.
➡️Recommended U (QK [Quarter Kelly]): Using the Kelly Criterion formula, the recommended amount to wager on this bet. I am using Quarter Kelly (QK) here, which most people consider to be 1u, but depending on how aggressive or conservative you want your investment approach to be you can scale accordingly. See this post for more on determining your Unit Size based on your Bankroll. As an example if this column reads .35 the model is recommending .35u on this bet. If your bankroll is $1000, your unit size is $10, and therefore you would be $3.50 on this bet if you are following QK.
⭐ RATINGS ⭐
(Excellent is always best - ideally you would want four stars across all the factors and this would indicate the player has an outsized chance based on all factors!)
➡️Game High Score Potential: The potential for this game as a whole to be high scoring (combo of both teams avg goals scored and allowed per game, goalie strength, and more)
➡️Player Line Advantage: How advantageous this player's line AND power play line are (if applicable - the grade is combining their edge in both situations) vs. the opposing team's defense against those lines. For example, if a player is on the first line and their team's first line is in the top 10% of scoring, and they are going against a team that is in the top 10% of goals given up to the opposing team's first line, that would likely qualify as Excellent.
➡️Team Offensive Grade: How strong the player's team is offensively (goals/game, power play %, shot %, and more!)
➡️Opponent Defense Grade: How weak the other teams defense is (factors like goals against, penalty kill %, shot block %, and more!) - an Excellent rating here means the opponent has a WEAK defense, therefore a benefit to the player in this row
➡️Opp. Goalie GA (Goals Allowed) %: Goals allowed as a % of shots for the projected goalie for the opposing team - an Excellent rating here means this goalie lets in more goals per shot attempts (compared to other league starting goalies - top X percentile) therefore is a benefit for the player in this row
📈 DAILY PERFORMANCE RECAP 📈


Daily Performance Recap:
Results by Flat Rate vs. Results by QK:
Target list results can be tracked by either the Flat Rate performance (betting 1U on every player in the cohort) or by the QK performance (betting the recommended QK on every player in the cohort). The remaining cohorts are only tracked at Flat Rate as it would not make sense to track at QK (i.e., any player with negative value shows as zero QK, so you are not seeing the full picture of performance for any non-value players).
Each row is a “Cohort”:
➡️Targets: The players on yesterday’s target list (met the objectives for Data and Value)
➡️Non-Targets: All other players (every player NOT on the Target List)
➡️Top 6 by Game: All players who were on yesterday’s Top 6 by Game List
➡️Below Top 6: All other players (every player BELOW top 6 by Game)
➡️All Players is MECE: it is the sum of both Targets + Non-Targets, and the sum of Top 6 + Below Top 6
➡️➡️Targets + Non-Targets = All Players = Top 6 by Game + Below Top 6 by Game
Note the reason for including cohorts like “Non-Targets” and “Below Top 6” is to show a BENCHMARK for better evaluating the performance of our Targets and Top 6 List: if the model is working as intended, Targets should out-perform Non-Targets and Top 6 List should out-perform Below Top 6 in ROI
Columns for Results:
➡️Hits / Total: The number of players that hit the objective (an anytime goal) / the total number of players who are in the cohort
➡️Profit (U): The amount that would be profited if you had bet on every player in the cohort (at either Flat Rate [top section] or QK [bottom section])
➡️ROI (Return on Investment) = Profit / Total Investment
➡️➡️ Total investment is the total risked on the cohort at either Flat Rate or QK
➡️Hit Rate: Hits / Total as a %
➡️➡️ The chart in the bottom right will show you the Hit Rate for each Score Group (all players whose scores fall in the specified range) - this gives you an indication of future probabilities for players rated in each score group
Target List Results:
So you can easily track the performance from one day to the next, this shows the full player list from yesterday’s target list, who achieved the outcome (# goals), and how much was profited or lost on each player at either Flat Rate or QK.
➡️➡️ P/L = Profit/Loss
⚠️ It should go without saying, but this is not financial advice. This is gambling, and nothing is guaranteed. Wager at your own risk & discretion ⚠️